BLOG
MARKET INTEL by PharmaCompass
CONTENT by Suppliers
- Interview #SpeakPharma
- Video #SupplierSpotlight
- Vlog #PharmaReel
- Company Bio #AboutSupplier
- Services Bio #AboutCapabilities
News
Create content with us, ask us
In less than three weeks, Donald Trump will assume office as the President of the United States. He has mentioned that he wants Medicare (a national social insurance program) to directly negotiate the price it pays for prescription drugs.
Medicare provides health insurance to Americans aged 65 or more, who have worked and paid into the system through the payroll tax. It also provides health insurance to younger people with some disabilities or end-stage renal disease and amyotrophic lateral sclerosis.
In 2015, Medicare provided health insurance to over 55 million Americans — including 46 million people aged 65 or more, and nine million younger people.
As we flag off the New Year, PharmaCompass
provides insights into drug prices and prescription patterns in the US in order
to help professionals make informed decisions. We believe that the cost of
medicines in the US, which have been a subject of much public outcry and
discussions in the recent years, will continue to be scrutinized during 2017.
Medicare data for 2014
Medicare Part D, also known as the Medicare prescription drug benefit — the program which subsidizes the costs of prescription drugs and prescription drug insurance premiums for Medicare beneficiaries — published a data set (for calendar year 2014) which contains information from over one million healthcare providers who collectively prescribed approximately US $121 billion worth of prescription drugs paid for under this program.
For each prescriber and drug, the dataset includes the total number of prescriptions that were dispensed (including original prescriptions and any refills), and the total drug cost.
The total drug cost includes the ingredient cost of the medication, dispensing fees, sales tax, and any applicable administration fees. It’s based on the amounts paid by the Part D plan, the Medicare beneficiary, other government subsidies, and any other third-party payers (such as employers and liability insurers).
The total drug cost does not reflect any manufacturer rebates paid to Part D plan sponsors through direct and indirect remuneration or point-of sale rebates. In order to protect the beneficiary’s privacy, the Centers for Medicare & Medicaid Services (CMS) did not
include information in cases where 10 or fewer prescriptions were dispensed.
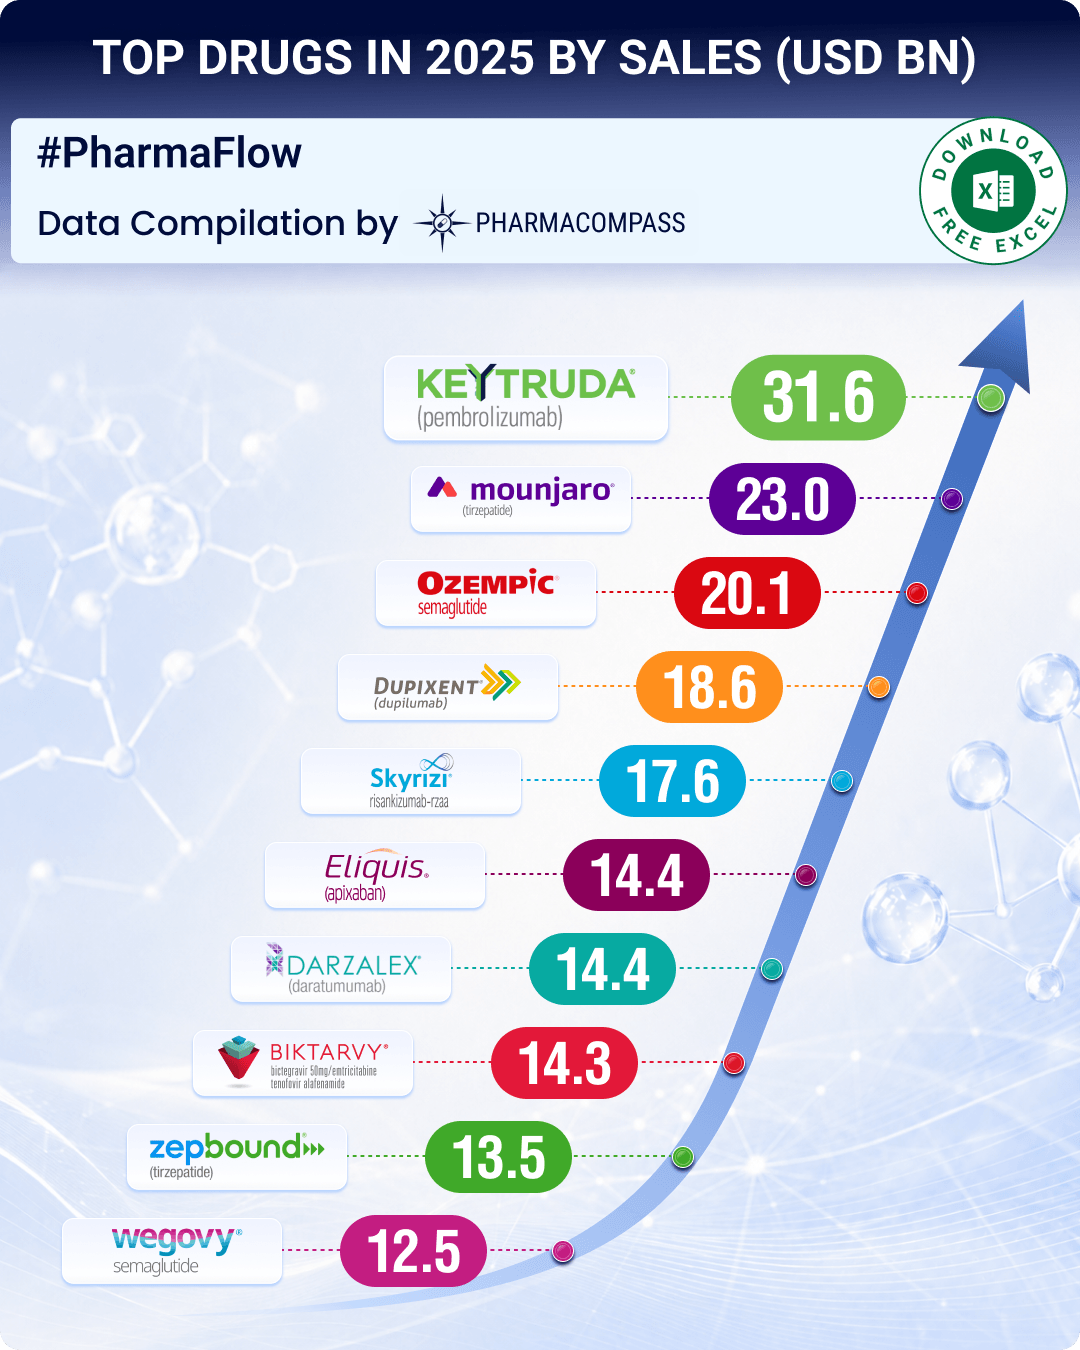
Top
Ten Drugs by Cost, 2014 [Most expensive for Medicare]
|
Drug Name |
Total Claim Count |
Beneficiary Count |
Prescriber Count |
Total Drug Cost |
|
109,543 |
33,028 |
7,323 |
$3,106,589,192 |
|
|
7,537,736 |
1,405,570 |
286,927 |
$2,660,052,054 |
|
|
9,072,799 |
1,752,423 |
266,499 |
$2,543,475,142 |
|
|
2,963,457 |
405,048 |
130,933 |
$2,526,731,476 |
|
|
6,093,354 |
1,420,515 |
281,775 |
$2,276,060,161 |
|
|
5,852,258 |
1,211,919 |
253,277 |
$2,158,219,163 |
|
|
Lantus Solostar |
4,441,782 |
972,882 |
224,710 |
$2,016,728,436 |
|
4,495,964 |
789,828 |
190,741 |
$1,775,094,282 |
|
|
Lantus (Insulin Glargine) |
4,284,173 |
787,077 |
223,502 |
$1,725,391,907 |
|
178,373 |
27,142 |
9,337 |
$1,671,610,362 |
View the Medicare Part D National Prescriber Summary Report, Calendar Year 2014 (Excel version available) for FREE!
Top Ten Drugs by Average Cost per Claim, 2014 [Most expensive drugs]
|
Drug Name |
Total Claim Count |
Beneficiary Count |
Prescriber Count |
Total Drug Cost |
Average Cost Per Claim |
|
13 |
$1,224,835 |
$94,218 |
|||
|
Elaprase |
100 |
$6,560,225 |
$65,602 |
||
|
Cinryze |
1,820 |
194 |
196 |
$96,155,785 |
$52,833 |
|
60 |
$2,901,115 |
$48,352 |
|||
|
Naglazyme |
129 |
$6,189,045 |
$47,977 |
||
|
Berinert |
538 |
73 |
68 |
$25,685,311 |
$47,742 |
|
1,568 |
269 |
232 |
$70,948,143 |
$45,248 |
|
|
9,611 |
2,932 |
1,621 |
$391,189,653 |
$40,702 |
|
|
314 |
41 |
47 |
$12,542,911 |
$39,946 |
|
|
15 |
$598,210 |
$39,881 |
Top
Ten Drugs by Claims, 2014 [Most Commonly Used by Patients]
|
Generic Name |
Total Claim Count |
Beneficiary Count |
Prescriber Count |
Total Drug Cost |
|
38,278,860 |
7,454,940 |
464,747 |
$281,614,340 |
|
|
37,711,869 |
6,245,507 |
416,518 |
$631,855,415 |
|
|
36,344,166 |
6,750,062 |
451,350 |
$303,779,661 |
|
|
34,092,548 |
6,768,159 |
387,651 |
$346,677,118 |
|
|
33,446,696 |
8,005,790 |
677,865 |
$676,296,988 |
|
|
33,032,770 |
6,707,964 |
475,122 |
$529,050,385 |
|
|
32,603,055 |
6,740,061 |
419,327 |
$747,635,818 |
|
|
27,133,430 |
5,176,582 |
456,047 |
$135,710,772 |
|
|
23,475,787 |
4,509,978 |
364,273 |
$203,948,989 |
|
|
22,143,641 |
4,298,609 |
486,754 |
$492,557,255 |
View the Medicare Part D National Prescriber Summary Report, Calendar Year 2014 (Excel version available) for FREE!
Top
Ten Drugs by Prescribers, 2014 [Most Popular with Doctors]
|
Generic Name |
Total Claim Count |
Beneficiary Count |
Prescriber Count |
Total Drug Cost |
|
33,446,696 |
8,005,790 |
677,865 |
$676,296,988 |
|
|
7,253,018 |
4,926,835 |
568,201 |
$46,728,353 |
|
|
6,298,980 |
4,384,899 |
557,614 |
$31,193,739 |
|
|
5,040,219 |
3,529,303 |
557,048 |
$36,987,401 |
|
|
7,339,954 |
5,274,010 |
544,625 |
$70,699,119 |
|
|
11,032,986 |
4,505,821 |
536,108 |
$86,537,932 |
|
|
14,250,227 |
4,272,724 |
515,816 |
$125,343,514 |
|
|
4,833,758 |
3,090,944 |
500,790 |
$29,231,511 |
|
|
22,143,641 |
4,298,609 |
486,754 |
$492,557,255 |
|
|
3,551,452 |
2,710,244 |
478,361 |
$61,713,432 |
The findings from CMS
data
The CY 2014 data represented a 17 percent increase compared to the 2013 data set and a substantial part of the total estimated prescription drug spending (as estimated by the Department of Health and Human Services Office of the Assistant Secretary for Planning and Evaluation, or ASPE) in the United States — at about US $ 457 billion in 2015, which was 16.7 percent of the overall personal healthcare services.
Of that US $ 457 billion, US $ 328 billion (71.9 percent) was for retail drugs and US $ 128 billion (28.1 percent) was for non-retail drugs.
The drug pricing process in the US is complex and reflects the influence of numerous factors, including manufacturer list prices, confidential negotiated discounts and rebates, insurance plan benefit designs, and patient choices.
An IMS study found that across 12 therapy classes widely used in Medicare Part D, medicine costs to plans and patients in Medicare Part D are 35 percent below list prices.
View the Medicare Part D National Prescriber Summary Report, Calendar Year 2014 (Excel version available) for FREE!
While the CMS does not currently have an established formulary, Part D drug coverage excludes drugs not approved by the US Food and Drug Administration, those prescribed for off-label use, drugs not available by prescription for purchase in the US, and drugs for which payments would be available under Parts A or B of Medicare.
Part D coverage excludes drugs or classes of drugs excluded from Medicaid coverage, such as:
- Drugs used for anorexia, weight loss, or weight gain
- Drugs used to promote fertility
- Drugs used for erectile dysfunction
- Drugs used for cosmetic purposes (hair growth, etc.)
- Drugs used for the symptomatic relief of cough and colds
- Prescription vitamins and mineral products, except prenatal vitamins and fluoride preparations
- Drugs where the manufacturer requires (as a condition of sale) any associated tests or monitoring services to be purchased exclusively from that manufacturer or its designee
Our view
The Medicare program is designed such that the federal government is not permitted to negotiate prices of drugs with the drug companies, as federal agencies do under other programs.
For instance, the Department of Veterans Affairs — which is allowed to negotiate drug prices and establish a formulary — has been estimated to pay (on an average) between 40 to 58 percent less for drugs, as opposed to Medicare Part D.
If Trump administration kick starts direct
negotiations on Medicare drug prices with drug companies, 2017 will surely turn
out to be a year for the pharmaceutical industry to remember.
The PharmaCompass Newsletter – Sign Up, Stay Ahead
Feedback, help us to improve. Click here
Image Credit : PharmaCompass on Times Square Dec 2016 by Sachin is licensed under CC BY 2.0
“ The article is based on the information available in public and which the author believes to be true. The author is not disseminating any information, which the author believes or knows, is confidential or in conflict with the privacy of any person. The views expressed or information supplied through this article is mere opinion and observation of the author. The author does not intend to defame, insult or, cause loss or damage to anyone, in any manner, through this article.”