The year
2021 was eclipsed by the Covid-19 pandemic. In our update for the first half of 2020, we had mentioned that
Covid-19 has not slowed down the speed at which generic active pharmaceutical
ingredient (API) manufacturers were submitting Drug Master Files (DMFs) to the
US Food and Drug Administration (FDA). That trend continued in 2021, when the
speed of DMF submissions to the agency remained similar to that witnessed in
the previous years.
In fact,
Type II DMFs, or DMFs for active pharmaceutical ingredients (APIs), were higher
in 2021 as compared to previous years. In the first quarter, FDA received 164
Type II DMF submissions, which rose to 165, 166 and 172 submissions over the
next three quarters. In all, 667 Type II DMFs were filed in 2021, as opposed to
662 in 2020, 633 in 2019 and 644 in 2018.
DMFs are
submissions made to the FDA by manufacturers who provide the agency with
confidential, detailed information about facilities, processes or articles used
in manufacturing, processing, packaging and storing of human drug
products.
Overall,
2021 saw a total of 913 DMFs (Type II, III, IV and V) being submitted. In
comparison, FDA had received 931 DMF submissions in 2020, 894 in 2019 and 979
in 2018.
View FDA DMF Filings in 2021 (Power BI Dashboard, Free Excel Available)
India
continues to lead DMF filings, followed by China
Country-wise
data on DMF filings at
the FDA tells us the potential of a country in the field of pharmaceuticals. At the company-level, with each DMF filing, a firm commits itself to manufacturing drugs in a facility that is aligned to the FDA’s rules and regulations.
This year
too, DMFs filed from India and China were significantly higher than those from
other countries. Expectedly, India continued to lead with 376 DMF filings.
Submissions from India were over twice that of DMF filings from China (at 159).
This is not surprising since the two countries have the maximum number of API
manufacturing facilities registered with the FDA.
As compared
to this, the United States had 52 DMF filings, Italy had 10, Spain and Taiwan
had 9 each, and countries like Canada, Israel, Japan and UK had five DMF
filings each.
View FDA DMF Filings in 2021 (Power BI Dashboard, Free Excel Available)
India’s MSN Labs leads DMF count
As in the
past, India's MSN Laboratories continued to lead the DMF filings by a single company with 43 submissions. MSN was followed by five other Indian companies — Dr. Reddy’s Laboratories filed 15 submissions, Hetero Group and Aurobindo Pharma 14, Metrochem API 13 and Aurore Life Sciences filed 12 DMF submissions.
The only
Chinese company in the top 10 by DMF count was Brightgene Bio-Medical Technology Limited with nine DMF submissions.
The maximum
number of DMF filings were for semaglutide (eight), followed by favipiravir (seven), apalutamide (six), sitagliptin phosphate (six) and tofacitinib citrate (six). Others like acalabrutinib, elagolix sodium, lenalidomide, liraglutide and pantoprazole sodium had five DMF filings each.
View FDA DMF Filings in 2021 (Power BI Dashboard, Free Excel Available)
Slow
assessment review, higher GDUFA fee
Although
there were 667 Type II DMFs filed with the FDA, only 194 (or 29 percent) had
their review completed. The GDUFA (short for Generic Drug User Fee Amendments)
fee associated with a DMF assessment review for 2021 was considerably higher — at US$ 69,921 — as opposed to US$ 57,795 for 2020. For FY 2022, the GDUFA fee has been revised upward to US$ 74,952 (an increase of US$ 5,031).
There are 42
products for which a DMF was filed for the first time. Among the patented
products which should expect generic competition are avatrombopag, encorafenib, esketamine hydrochloride, siponimod fumaric acid, tedizolid phosphate and vorapaxar sulfate.
In fact,
DMFs were also filed for products that are yet to receive an FDA approval. Some of these products are imeglimin, aviptadil, gimeracil, linzagolix choline, meglumine antimoniate, roluperidone hydrochloride and teneligliptin.
View FDA DMF Filings in 2021 (Power BI Dashboard, Free Excel Available)
Our view
The Covid-19
pandemic revealed how the global supply chain for pharmaceuticals is excessively dependent on India and China. As a
result, many countries across the world are making investments into expanding
their API production capacities. This should translate into more Type II DMF
filings from countries other than India and China.
Moreover, as the pandemic begins to wane and the FDA increases its inspections — both domestic and international — compliance issues are bound to increase. The US is planning to run a pilot program
soon that will test a system of unannounced inspections in India and China.
Companies in both India and China will need to increase their focus on
compliance if they wish to continue to be major contributors to the global
supply chain for pharmaceuticals. We can certainly expect more regulatory news
in 2022.View FDA DMF Filings in 2021 (Power BI Dashboard, Free Excel Available)
Impressions: 5380
Nearly every
year, drugmakers ring in the new year with drug price increases in the US. This
year too, prices of over 450 prescription
medicines increased by an average of around 5 percent at the start of January.
This, when high drug prices have been one of the biggest political issues in
the US over the last few years.
PharmaCompass decided to usher in 2022 with a review of the US Medicare Part D Prescription Drug data recently released by the Centers for Medicare and Medicaid Services (CMS) for calendar year 2019. Using the available data, we have developed our own dashboard to show recent trends in consumption of prescription drugs. With this analysis, we hope our readers will get a better understanding of the world’s largest market for pharmaceuticals, as also a fix on where it may be headed.
View US Medicare Part D 2019 Drug Spending (Free Excel Available)
Rising healthcare, drug spends in US
Over the
last several years, we have repeatedly heard political leaders in the US
complain about high drug prices. Yet, drug prices and healthcare spends have
risen unabated.
America’s National Health Expenditure Accounts (NHEA) includes annual expenditures on healthcare goods and services, public health activities, the net cost of health insurance, and investment related to healthcare. In 2019, America’s national health expenditure (NHE) grew by 4.6 percent to US$ 3.8
trillion, accounting for 17.7 percent of the gross domestic product (GDP).
During the year, prescription drug spend increased by 5.7
percent to US$ 369.7 billion. In comparison, Medicare spend grew 6.7
percent to US$ 799.4 billion.
President
Joe Biden recently stressed on the need to cap the prices of essential drugs,
and said that the average American pays the highest prices for prescription
drugs anywhere in the world. Americans pay 10 times as much as other countries for life-saving insulin — the top selling prescription drug covered by the Part D program.
Pharma
companies, on the other hand, have vehemently argued against any price cuts in
the US, saying price cuts would hinder drug research and development for all
diseases.
View US Medicare Part D 2019 Drug Spending (Free Excel Available)
Patented drugs account for 80.3 percent of total Part D spend
Medicare is the US federal government’s program that
provides health insurance to most people who are 65 years
or older. Medicare’s Part D plan provides outpatient drug coverage through private
insurance companies that have contracts with the federal government. Eligible
people have to choose and enroll in a private prescription drug plan for Part D
coverage. Medicare Part B, on the other hand, covers a wide variety of
medically necessary outpatient services and some preventative services.
Prescription
drug coverage under Part D reached US$ 183 billion in 2019 — a growth of around 9 percent over 2018, when spending was US$ 168 billion. Spending
on patented drugs in 2019 accounted for around US$ 147 billion or 80.3 percent
of the total spend for the year. Generic drugs made up for the remaining 19.7
percent (approximately US$ 36 billion). In 2018, generic drugs worth US$ 35.8
billion were sold under Part D, accounting for 21 percent of the total spend
under the program.
View US Medicare Part D 2019 Drug Spending (Free Excel Available)
Eliquis ranks highest on Medicare’s brand drug spend
Under Part
D, endocrinology and oncology were the two therapeutic areas that generated
maximum revenue for pharma companies, driving home sales of over US$ 31.8
billion and US$ 23.5 billion, respectively. Neurology drugs generated sales of
around US$ 22.9 billion.
Among branded
drugs, Bristol Myers Squibb’s anticoagulant Eliquis (apixaban) was the most selling drug in 2019 under Part D, notching up about US$ 7.3 billion in sales — a rise of US$ 2.3 billion or 46 percent over 2018.
Celgene’s cancer drug Revlimid (lenalidomide) roped in US$ 4.7 billion (up
by 14.6 percent), while another anticoagulant drug Xarelto (rivaroxaban) by Janssen Pharma — a unit of Johnson & Johnson — fetched US$ 4.1 billion (up 20.6 percent) in sales through Part D. AbbVie’s anti-rheumatic drug Humira and Sanofi’s diabetes drug Lantus saw sales of around US$ 3.7 billion each
under the program.
Amongst
generics, the largest selling drug under Part D (by dosage units) was metformin (diabetes), followed by gabapentin (seizure), PEG3350 with
electrolyte (gastroenterology), metoprolol (hypertension) and atorvastatin (cholesterol). In 2019, the
overall dosage units sold also jumped higher by 2.25 billion units to 111.35
billion.
The sales
ranking of Part D does bare some similarities with the global ranking of
highest selling drugs. In 2020, Humira had retained its position as the highest
selling drug in the world, generating sales of US$ 20.4 billion. Both
Eliquis and Revlimid had retained their ranking as the third and fourth most
selling drugs, bringing home US$ 14.1 billion and US$ 12.1 billion in global
sales in 2020.
View US Medicare Part D 2019 Drug Spending (Free Excel Available)
Medicare’s inability to negotiate prices costs American taxpayers billions of dollars
Over the
years, drug companies have used Medicare’s
inability to negotiate prices under Part D to increase the prices of their
drugs significantly and rip off huge profits, a three-year-long US House
Oversight Committee investigation has revealed.
US taxpayers could have saved over US$ 25 billion in five years if the prices of just seven drugs — Humira, Imbruvica, Sensipar, Enbrel, Lantus, NovoLog and Lyrica — were negotiated by Medicare. Another US$ 16.7 billion could have been saved between
2011 and 2017 on insulin products manufactured by Eli Lilly, Novo Nordisk and Sanofi, which control 90 percent of the insulin market in the US, the committee’s report revealed.
Elsewhere in
the world, the same drugmakers are bending over backwards to get into medical
insurance programs. For instance, China reported that several international
pharma firms, many of them headquartered in the US, slashed the prices of their
drugs by up to 94 percent to get into the country’s national medical insurance coverage.
In the US — which accounted for around 46 percent of the global share of drugs in 2020 — senior citizens may have to pay more for medicines as the government announced a large hike in Medicare premiums for 2022
if an expensive Alzheimer’s drug, Aduhelm, is included in the list.
In order to
ensure inclusion in Medicare, Biogen slashed the price of Aduhelm by half — from US$ 56,000 to US$ 28,200 — just weeks before a crucial meeting called by the CMS. Clearly, this has set a precedent in an industry which is known for rampant price hikes and rarely for any price cuts. This could also be put forth as an example of what Medicare could achieve if it receives negotiation rights.
View US Medicare Part D 2019 Drug Spending (Free Excel Available)
Our view
President
Biden's Build Back Better legislation,
which the House passed last month, is up for vote in the Senate. The
legislation contains provisions that would allow Medicare to negotiate the
prices of some expensive drugs, penalize drugmakers who raise prices faster
than inflation and cap out-of-pocket costs for insulin at US$ 35 per month.
However, chances of the bill being passed in its present form are slim.
Even if the
Senate passes the bill, Medicare would be able to negotiate the prices of only 10 prescription drugs and insulin products in 2025.
The number would increase over the years, reaching 100 in six years, and hence
forth grow by 20 drugs a year.
It seems like 2022 won’t be the last year when January 1 will be braced with price hikes in the US by drugmakers. Looks like they will continue to make hay while the sun shines.
View US Medicare Part D 2019 Drug Spending (Free Excel Available)
Impressions: 2622
Acquisitions and spin-offs dominated headlines in 2019 and the tone was set very early with Bristol-Myers Squibb acquiring
New Jersey-based cancer drug company Celgene in a US$ 74 billion deal announced on
January 3, 2019. After factoring
in debt, the deal value ballooned to about US$ 95 billion, which according
to data compiled by Refinitiv, made it the largest healthcare deal on
record.
In the summer, AbbVie Inc,
which sells the world’s best-selling drug Humira, announced its acquisition of Allergan Plc, known for Botox and other cosmetic
treatments, for US$ 63 billion. While the companies are still awaiting
regulatory approval for their deal, with US$ 49 billion in combined 2019
revenues, the merged entity would rank amongst the biggest in the industry.
View Our Interactive Dashboard on Top drugs by sales in 2019 (Free Excel Available)
The big five by pharmaceutical sales — Pfizer,
Roche, J&J, Novartis and Merck
Pfizer
continued
to lead companies by pharmaceutical sales by reporting annual 2019 revenues of
US$ 51.8 billion, a decrease of US$ 1.9 billion, or 4 percent, compared to
2018. The decline was primarily attributed to the loss of exclusivity of Lyrica in 2019,
which witnessed its sales drop from US$ 5 billion in 2018 to US$ 3.3 billion in
2019.
In 2018, Pfizer’s then incoming CEO Albert Bourla had mentioned that the company did not see the need for any large-scale M&A activity as Pfizer had “the best pipeline” in its history, which needed the company to focus on deploying its capital to keep its pipeline flowing and execute on its drug launches.
Bourla stayed true to his word and barring the acquisition of Array Biopharma for US$ 11.4 billion and a spin-off to merge Upjohn, Pfizer’s off-patent branded and generic established medicines business with
Mylan, there weren’t any other big ticket deals which were announced.
The
Upjohn-Mylan merged entity will be called Viatris and is expected to have 2020
revenues between US$ 19 and US$ 20 billion
and could outpace Teva to
become the largest generic company in the world, in term of revenues.
Novartis, which had
followed Pfizer with the second largest revenues in the pharmaceutical industry
in 2018, reported its first full year earnings after spinning off its Alcon eye
care devices business division that
had US$ 7.15 billion in 2018 sales.
In 2019,
Novartis slipped two spots in the ranking after reporting total sales of US$
47.4 billion and its CEO Vas Narasimhan continued his deal-making spree by buying New
Jersey-headquartered The Medicines Company (MedCo) for US$ 9.7
billion to acquire a late-stage cholesterol-lowering
therapy named inclisiran.
As Takeda Pharmaceutical Co was
busy in 2019 on working to reduce its debt burden incurred due to its US$ 62
billion purchase of Shire Plc, which was announced in 2018, Novartis also purchased
the eye-disease medicine, Xiidra, from the Japanese drugmaker for US$ 5.3 billion.
Novartis’ management also spent a considerable part of 2019 dealing with data-integrity concerns which emerged from its 2018 buyout of AveXis, the
gene-therapy maker Novartis had acquired for US$ 8.7 billion.
The deal gave Novartis rights to Zolgensma,
a novel treatment intended for children less than two years of age with the
most severe form of spinal muscular atrophy (SMA). Priced at US$ 2.1 million,
Zolgensma is currently the world’s most expensive drug.
However,
in a shocking announcement, a month after approving the drug, the US Food and
Drug Administration (FDA) issued a press release on
data accuracy issues as the agency was informed by AveXis that
its personnel had manipulated data which
the FDA used to evaluate product comparability and nonclinical (animal)
pharmacology as part of the biologics license application (BLA), which was
submitted and reviewed by the FDA.
With US$
50.0 billion (CHF 48.5 billion) in annual pharmaceutical sales, Swiss drugmaker
Roche came in at number two position in 2019
as its sales grew 11 percent driven by
its multiple sclerosis medicine Ocrevus, haemophilia drug Hemlibra and cancer medicines Tecentriq and Perjeta.
Roche’s newly introduced medicines generated US$ 5.53 billion (CHF 5.4 billion) in growth, helping offset the impact of the competition from biosimilars for its three best-selling drugs MabThera/Rituxan, Herceptin and Avastin.
In late 2019, after months of increased
antitrust scrutiny, Roche completed
its US$ 5.1 billion acquisition of Spark Therapeutics to strengthen its presence in
gene therapy.
Last year, J&J reported almost flat worldwide sales of US$ 82.1 billion. J&J’s pharmaceutical division generated US$ 42.20 billion and its medical devices and consumer health divisions brought in US$ 25.96 billion and US$ 13.89 billion respectively.
Since J&J’s consumer health division sells analgesics, digestive health along with beauty and oral care products, the US$ 5.43 billion in consumer health sales from over-the-counter drugs and women’s health products was only used in our assessment of J&J’s total pharmaceutical revenues. With combined pharmaceutical sales of US$ 47.63 billion, J&J made it to number three on our list.
While the sales of products like Stelara, Darzalex, Imbruvica, Invega Sustenna drove J&J’s pharmaceutical business to grow by 4 percent over 2018, the firm had to contend with generic competition against key revenue contributors Remicade and Zytiga.
US-headquartered Merck, which is known as
MSD (short for Merck Sharp & Dohme) outside the United States and
Canada, is set to significantly move up the rankings next year fueled by its
cancer drug Keytruda, which witnessed a 55
percent increase in sales to US$ 11.1 billion.
Merck reported total revenues of US$ 41.75 billion and also
announced it will spin off its women’s health drugs,
biosimilar drugs and older products to create a new pharmaceutical
company with US$ 6.5 billion in annual revenues.
The firm had anticipated 2020 sales between US$ 48.8 billion and US$ 50.3 billion however this week it announced that the coronavirus pandemic will reduce 2020 sales by more than $2 billion.
View Our Interactive Dashboard on Top drugs by sales in 2019 (Free Excel Available)
Humira holds on to remain world’s best-selling drug
AbbVie’s acquisition of Allergan comes as the firm faces the expiration of patent protection for Humira, which brought in a staggering US$ 19.2 billion in sales last year for
the company. AbbVie has failed to successfully acquire or develop a major new
product to replace the sales generated by its flagship drug.
In 2019, Humira’s US revenues increased 8.6 percent to US$ 14.86 billion while internationally, due
to biosimilar competition, the sales dropped 31.1 percent to US$ 4.30 billion.
Bristol Myers Squibb’s Eliquis, which is also marketed by Pfizer, maintained its number two position
and posted total sales of US$ 12.1 billion, a 23 percent increase over 2018.
While Bristol Myers Squibb’s immunotherapy treatment Opdivo, sold in partnership with Ono in Japan, saw sales increase from US$ 7.57 billion to US$ 8.0 billion, the growth paled in comparison to the US$ 3.9
billion revenue increase of Opdivo’s key immunotherapy competitor Merck’s Keytruda.
Keytruda took the number three spot in drug sales that
previously belonged to Celgene’s Revlimid, which witnessed a sales decline from US$ 9.69 billion to US$ 9.4 billion.
Cancer treatment Imbruvica, which is marketed
by J&J and AbbVie, witnessed a 30 percent increase in sales. With US$ 8.1
billion in 2019 revenues, it took the number five position.
View Our Interactive Dashboard on Top drugs by sales in 2019 (Free Excel Available)
Vaccines – Covid-19 turns competitors into partners
This year has been dominated by the single biggest health emergency in years — the novel coronavirus (Covid-19) pandemic. As drugs continue to fail to meet expectations, vaccine development has received a lot of attention.
GSK reported the highest vaccine sales of all drugmakers with
total sales of US$ 8.4 billion (GBP 7.16 billion), a significant portion of its
total sales of US$ 41.8 billion (GBP 33.754 billion).
US-based Merck’s vaccine division also reported a significant increase in sales to US$ 8.0 billion and in 2019 received FDA and EU approval to market its Ebola vaccine Ervebo.
This is the first FDA-authorized vaccine against the deadly virus which causes
hemorrhagic fever and spreads from person to person through direct contact with
body fluids.
Pfizer and Sanofi also reported an increase in their vaccine sales to US$ 6.4
billion and US$ 6.2 billion respectively and the Covid-19 pandemic has recently
pushed drugmakers to move faster than ever before and has also converted
competitors into partners.
In a rare move, drug behemoths — Sanofi and GlaxoSmithKline (GSK) —joined hands to develop a vaccine for the novel coronavirus.
The two companies plan to start human trials
in the second half of this year, and if things go right, they will file
for potential approvals by the second half of 2021.
View Our Interactive Dashboard on Top drugs by sales in 2019 (Free Excel Available)
Our view
Covid-19 has brought the world economy to a grinding halt and shifted the global attention to the pharmaceutical industry’s capability to deliver solutions to address this pandemic.
Our compilation shows that vaccines and drugs
for infectious diseases currently form a tiny fraction of the total sales of
pharmaceutical companies and few drugs against infectious diseases rank high on
the sales list.
This could well explain the limited range of
options currently available to fight Covid-19. With the pandemic currently infecting
over 3 million people spread across more than 200 countries, we can safely
conclude that the scenario in 2020 will change substantially. And so should our
compilation of top drugs for the year.
View Our Interactive Dashboard on Top drugs by sales in 2019 (Free Excel Available)
Impressions: 54752
This week, PharmaCompass reviews the recently released data of the Medicare Part D Prescription Drug Program in the United States for calendar year 2017.
The US market is the world’s largest and most important pharmaceutical market, accounting around 45 percent of the global share of drugs, and was valued at US$ 466 billion in 2017.
View Our Interactive Dashboard on Medicare Part D 2017 Spending (Free Excel Available)
What is Medicare?
Medicare is the federal health insurance program in the US which covered 58.4 million people in 2017 — 49.5 million aged 65 and older, and 8.9 million disabled.
The National Health Expenditure (NHE) in the US grew 3.9 percent to US$ 3.5 trillion in 2017 and accounted for 17.9 percent of the gross domestic product
(GDP). As a result, Medicare spending grew 4.2 percent to US$ 705.9 billion in
2017, or 20 percent of the total NHE.
Prescription
drug spending in the US increased to US$ 333.4 billion in 2017 while prescription drug coverage under the Medicare program,
known as Medicare Part D, reached US$ 151.6 billion in 2017, a little less than half of the total prescription
drug spending in the United States.
View Our Interactive Dashboard on Medicare Part D 2017 Spending (Free Excel Available)
Why has Medicare been in news?
The Medicare Part D drug benefit is delivered by private drug plans, which are mostly chosen by the program’s participants. Under Part D, drug prices are determined primarily through negotiations between Part D plans and providers (such as pharmacies and drug manufacturers). A key factor that helps Part D plans lower drug costs are rebate payments that the plans negotiate with drug manufacturers.
With drug pricing debate raging in the
United States, these rebate payments have come under a lot of scrutiny.
View Our Interactive Dashboard on Medicare Part D 2017 Spending (Free Excel Available)
During the hearing of Big Pharma executives summoned by the Senate
Financing Committee last month, Sanofi’s CEO Olivier Brandicourt detailed a chart showing Sanofi and Genzyme's US sales from 2018, explaining how as much as 55 percent of Sanofi’s gross sales were given back to payers as rebates.
The chart showed how out of Sanofi’s US$ 21.6 billion in gross sales in 2018, US$ 4.5 billion was given back in mandatory rebates to government payers and US$ 7.3 billion in discretionary rebates.
Earlier this month, the Trump administration
unveiled a budget that would reduce spending in Medicare as
well as Medicaid by hundreds of billions of dollars compared to the current
law.
View Our Interactive Dashboard on Medicare Part D 2017 Spending (Free Excel Available)
What are the insights available from the
2017 US Medicare Part D data?
The Medicare Drug Spending dashboards were updated earlier this month to include data for 2017, providing more
data and transparency to better identify trends and track consumption and price
changes over time.
Using the available data, PharmaCompass has developed its own dashboard to show
recent trends in consumption of prescription drugs under Medicare D. Our
dashboard also helps identify drugs with limited to no competition.
The data reveals that while almost 60 percent of the Medicare spend (nearly US$ 90 billion) is for drugs with only one manufacturer, i.e. mostly patented drugs, there is another US$ 12 billion spend on drugs which have only two manufacturers. The next highest spend — of US$ 4 billion — is on drugs with as many as five manufacturers.
This clearly indicates that if the market
can support up to five manufacturers for established products, increased
generic competition will significantly help Medicare reduce its Part D
prescription drug spending.
View Our Interactive Dashboard on Medicare Part D 2017 Spending (Free Excel Available)
Medicare’s highest spend was on Insulin Glargine (US$ 4.7 billion) followed by patented
drugs Celgene’s Revlimid (lenalidomide), Bristol-Myers Squibb’s Eliquis (apixaban), Merck’s Januvia (sitagliptin phosphate) and AbbVie’s Humira (adalimumab).
Drugs with limited to no competition can be
identified using the dashboard by sorting for drugs with few
manufacturers.
Information is also provided on drug uses
and clinical indications, thereby enabling comparison between different
medications for a given condition.
View Our Interactive Dashboard on Medicare Part D 2017 Spending (Free Excel Available)
Impressions: 4699
This week, PharmaCompass
reviews the recently released data on prescription drugs paid for under the
Medicare Part D Prescription Drug Program in the United States in calendar year
2016.
But first, let’s understand what is Medicare.
Medicare is the federal health insurance program in the US. In 2017, it covered 58.4 million people — 49.5 million aged 65 and older, and 8.9 million disabled.
Prescription drug coverage under this
program was started in 2006, and is known as Medicare Part D.
As part of this
coverage, the Centers for Medicare & Medicaid Services (CMS) contracts insurance
companies and other private companies, known as plan sponsors, that offer
prescription drug plans to their beneficiaries with varying drug coverage and
cost-sharing requirements.
In
2017, the Congressional Budget Office (CBO) had estimated that spending on
Medicare Part D would reach US$ 94 billion, or about 16 percent of all Medicare
expenditures for the year.
Click here to access the compilation of Medicare Part D
Prescriber Summary Report
According
to the CBO, Medicare Part D is the most significant expansion of the Medicare
program since it was created by Congress in 1965.
With
more than 1.48 billion claims from beneficiaries enrolled under the Part D
prescription drug benefit program under its umbrella, our analysis of Medicare
Part D provides valuable insights into how elderly Americans use prescription
drugs.
Top 10 drugs by
cost: The ones that bore the highest cost burden for Medicare
As in 2015, in 2016
too Gilead’s Hepatitis C treatment — Ledipasvir/Sofosbuvir (Harvoni) — remained the single drug highest payout under the Medicare Part D Prescription Drug Program with a total cost of US$ 4.4 billion.
As Gilead continued
to face competition from AbbVie and Merck in the Hepatitis C space, the spending on Harvoni was down
37 percent from US$ 7.03 billion in 2015.
Click here to access the compilation of Medicare Part D
Prescriber Summary Report
Celgene’s cancer treatment, Lenalidomide (Revlimid), Sanofi and Merck’s diabetes treatments and AstraZeneca’s Crestor (Rosuvastatin Calcium) for
cholesterol followed Harvoni. All together, they cost the Medicare program over US$ 10 billion.
Generic Name
Number of Medicare Part D Claims
Number of Medicare Beneficiaries
Number of Prescribers
Aggregate Cost Paid for Part D
Claims (In USD)
LEDIPASVIR/ SOFOSBUVIR (HARVONI)
141,665
52,782
12,097
4,398,534,465
LENALIDOMIDE
239,049
35,368
10,382
2,661,106,127
LANTUS SOLOSTAR (INSULIN
GLARGINE, HUM.REC.ANLOG )
5,028,485
1,075,248
245,447
2,526,048,766
SITAGLIPTIN PHOSPHATE
4,742,505
864,442
206,223
2,440,013,513
ROSUVASTATIN CALCIUM
6,012,444
1,560,050
249,981
2,322,724,007
FLUTICASONE/SALMETEROL
5,194,391
1,196,007
275,442
2,319,808,482
PREGABALIN
4,940,115
852,497
267,532
2,098,953,250
RIVAROXABAN
4,403,332
807,820
252,141
1,954,748,890
APIXABAN
4,455,782
826,969
231,631
1,926,107,484
TIOTROPIUM BROMIDE
4,153,162
903,494
235,564
1,818,857,361
Click here to access the compilation of Medicare Part D
Prescriber Summary Report
Top 10 drugs by claims: The most commonly
used drugs of 2016
With 46.6 million claims, the thyroid hormone deficiency treatment — Levothyroxine Sodium — retained its position of being the most claimed product under Medicare’s Part D Prescription Drug Program in 2016.
The number of
Medicare Part D claims includes original prescriptions and refills.
Following Levothyroxine Sodium was the lipid-lowering agent — Atorvastatin Calcium — which had 44.5 million Medicare Part D claims that
were filed by almost 9.4 million beneficiaries.
Generic
Name
Number
of Prescribers
Number
of Medicare Part D Claims
Number
of Medicare Beneficiaries
LEVOTHYROXINE SODIUM
669,999
46,617,109
8,091,785
ATORVASTATIN CALCIUM
494,973
44,595,686
9,435,633
AMLODIPINE BESYLATE
497,017
39,913,468
7,802,905
LISINOPRIL
490,452
39,469,840
8,009,954
OMEPRAZOLE
492,951
32,909,236
7,001,160
METFORMIN HCL
611,700
31,007,932
6,394,014
SIMVASTATIN
380,560
29,687,947
6,201,911
HYDROCODONE/ACETAMINOPHEN
660,617
28,595,150
7,265,882
FUROSEMIDE
488,352
27,878,243
5,421,598
GABAPENTIN
555,997
27,627,466
5,363,382
Click here
to access the compilation of Medicare Part D Prescriber Summary Report
Top 10 drugs by prescribers: Medicines that were most popular with
doctors
Among the prescribers, albuterol sulfate (salbutamol) and Diltiazem had
over 900,000 unique providers (or
doctors) prescribing the drug.
Albuterol (salbutamol) is
used to provide quick relief from wheezing and shortness
of breath while Diltiazem is used to prevent chest
pain (angina).
Also
on the list of popular drugs with prescribers is Hydrocodone-Acetaminophen.
With more doctors prescribing Hydrocodone-Acetaminophen (an
opioid) than commonly used antibiotics, such as Cephalexin, Ciprofloxacin and Amoxicillin, the
series of new FDA initiatives to combat the epidemic of opioid misuse and abuse
should change the position of opioids in the top 10 drugs by prescribers in the
coming years.
Click here to access the compilation of Medicare Part D
Prescriber Summary Report
Generic
Name
Number of
Prescribers
Number of
Medicare Part D Claims
Number of
Medicare Beneficiaries
ALBUTEROL SULFATE
985,427
13,100,354
5,417,718
DILTIAZEM HCL
931,159
8,142,004
1,982,550
POTASSIUM CHLORIDE
879,491
18,945,969
4,278,000
PEN NEEDLE, DIABETIC
677,210
5,281,778
1,795,046
LEVOTHYROXINE SODIUM
669,999
46,617,109
8,091,785
HYDROCODONE/ACETAMINOPHEN
660,617
28,595,150
7,265,882
METFORMIN HCL
611,700
31,007,932
6,394,014
CEPHALEXIN
597,647
5,603,879
3,933,373
CIPROFLOXACIN HCL
594,129
7,000,081
4,851,657
AZITHROMYCIN
591,028
7,958,625
5,734,122
What does the
future hold?
Although the Part D Prescriber PUF (public use file) has a wealth of information on payment and utilization for Medicare Part D prescriptions, the dataset has a number of limitations. Of particular importance is the fact that the data may not be representative of a physician’s entire practice or all of Medicare as it only includes information on beneficiaries enrolled in the Medicare Part D prescription drug program (i.e., approximately two-thirds of all Medicare beneficiaries).
Click here to access the compilation of Medicare Part D
Prescriber Summary Report
Last
month, the Office of the Inspector General (OIG)
reviewed
the Part D claims data for the years 2011 to 2015 for brand-name drugs.
The OIG’s report found that the total reimbursement for all brand-name drugs in Part D increased 77 percent from 2011 to 2015, despite a 17-percent decrease in the number of prescriptions for these drugs.
With soaring drug prices being an issue for
regular debate in the Unites States and President Trump announcing that his
team will use strategies to strengthen the negotiating powers under
Medicare Part D and Part B, it remains to be seen how the data on prescription drugs paid for under
the Medicare Part D Prescription Drug Program will change in the coming years.
Click here to access the compilation of Medicare Part D
Prescriber Summary Report
Impressions: 2500
The year 2017 was a landmark year for pharmaceutical
industries in the US and Europe, with a sharp increase in the number of new molecular entities (NMEs) being approved in both geographies.
The US Food
and Drug Administration (USFDA) approved 46 NMEs in 2017, the second highest
since 1996 when 53 NMEs were approved. In Europe, the European Medicines Agency
(EMA) approved 35 drugs with a new active substance, up from 27 in 2016.
Sales for most major pharmaceutical
companies continued to grow in 2017. Earnings forecasts for 2018 have been raised due to the recent US tax reform that has
generated investor hopes for accelerated dividend growth and share buyback
plans.
This week, PharmaCompass brings
you a compilation of the top drugs of 2017 by sales revenue.
Click here to Access All the 2017 Data (Excel
version available) for FREE!
Top-sellers: Humira races ahead, despite launch of biosimilars; Enbrel a distant second
There wasn’t any upheaval
at the top of the pharma drug sales charts. AbbVie’s anti-TNF (tumor necrosis factor) giant
Humira (adalimumab), which is approved to treat
psoriasis and rheumatoid arthritis, added
almost another US $3 billion to its 2016 sales and posted nearly US $19 billion in revenues.
Last year, AbbVie’s raised expectations for Humira’s earnings to reach US $21 billion in global sales by 2020. The
company believes this drug will continue to be a significant cash contributor
until 2025 and the US $21 billion sales forecast
by 2020 is about US $3 billion higher than its expectation two years ago.
In 2016, the US Food and Drug Administration
(FDA) approved Amgen’s Amjevita (adalimumab-atto) — a biosimilar of Humira. And in 2017, another Humira biosimilar — Boehringer Ingelheim’s Cyltezo
(adalimumab-adbm) — received approval from the FDA and European authorities.
Click here to Access All the 2017 Data (Excel
version available) for FREE!
Enbrel (etanercept),
the longest-used biologic medicine for the treatment of rheumatism around the
world, was the second best-selling drug with US $8.262 billion in 2017 sales.
The sales of the drug were down from US $9.366 billion in
2016 owing to lower selling prices and increased
competition, which in turn hurt demand.
Since it was first approved in the United States in 1998,
Enbrel has been approved in over 100 countries and the drug is promoted by Amgen,
Pfizer
and Takeda
in different geographies.
Novartis’ biosimilar copy of Enbrel, which got approved by the FDA in August
2016 for the treatment of patients with
rheumatoid arthritis (RA), plaque psoriasis, ankylosing spondylitis (AS) and
other diseases is still not on the market because of a patent-protection
challenge from Amgen.
Amgen is arguing in the US federal court
that its drug has patent protection until 2029.
Click here to Access All the 2017 Data (Excel
version available) for FREE!
Fast-growing drugs: Eylea and Revlimid bring
fortunes for Regeneron and Celgene
Regeneron’s
flagship eye treatment, Eylea (aflibercept) which is marketed by Bayer outside the United States, added another US $1 billion in
annual sales last year to record US $8.260 billion in total sales. Eylea net
sales grew 11 percent year-on-year in the US and 19 percent year-over-year
outside the US.
The company believes much of the recent
growth in the US was driven by demographic trends with an aging population as
well as an overall increase in the prevalence of diabetes.
These demographic trends are expected to
continue in the coming years, providing an opportunity for continued growth.
Eylea sales alone contribute 63 percent to Regeneron’s total sales.
Click here to Access All the 2017 Data (Excel
version available) for FREE!
Celgene’s
Revlimid
(lenalidomide)
— a thalidomide derivative introduced in 2004 as an immunomodulatory agent for the treatment of various cancers such as multiple myeloma — brought in an additional US $1.2 billion in 2017 sales and had total revenues of US $8.187 billion.
Revlimid continues to contribute more than 60 percent to the company’s total sales of US $13 billion.
Celgene received a setback this month as the
USFDA refused to consider Celgene’s
application for ozanimod, an experimental
treatment for relapsing multiple sclerosis. The treatment was being seen as a
key to the company’s fortunes as Celgene had
said ozanimod is worth US $4 billion to
US $6
billion a year in peak sales.
Click here to Access All the 2017 Data (Excel
version available) for FREE!
Gilead’s Hepatitis C franchise enters free fall
Gilead Sciences’ blockbuster hepatitis C drugs franchise that includes Sovaldi and Harvoni continue to feel the
competitive heat as they registered US $9.137
billion in 2017 sales, down from US $14.834
billion the previous year.
While reporting 2017 results, Gilead provided guidance for
2018 and said its sales of Hepatitis C drugs could fall
further to US $3.5 billion - US $4 billion. At their peak in 2015, Gilead’s Sovaldi and Harvoni had together generated
US $19.1 billion in sales.
One of the major reasons for this drop is AbbVie’s launch of its new treatment Mavyret
at a deep price discount to the competition. AbbVie
also claims to have the shortest treatment course at eight weeks, compared with
12 weeks or longer for other treatments.
AbbVie reported US $1.274 billion in Hepatitis C drug sales
in 2017, down from US $1.522 billion in 2016.
Click here to Access All the 2017 Data (Excel
version available) for FREE!
Novartis’ Gleevec, Merck’s cardiovascular drugs, GSK’s Advair face generic heat
Novartis’ Gleevec (imatinib), which had at one point become the best-selling drug for Novartis and had brought in US $3.323 billion for the company in 2016, started facing generic competition last year and the anti-cancer drug lost US $1.380 billion in sales to bring in ‘only’ US $1.943 billion last year.
The US patents of Merck’s cardiovascular drugs — Zetia (Ezetimibe)
and Vytorin (Ezetimibe
and Simvastatin) — expired in April 2017. In May 2010, Merck and Glenmark
Pharmaceuticals entered into an agreement that allowed Glenmark to launch
a generic version of Zetia in late 2016. The drugs
that had combined sales of US $3.701
billion in 2016 felt the generic heat in 2017 and the sales were US
$1.606 billion lower at US $2.095
billion.
Click here to Access All the 2017 Data (Excel
version available) for FREE!
GSK’s Advair, which was expected
to encounter generic competition in 2017, continued to breathe easy as the FDA
found deficiencies in the applications of Hikma, Mylan and Sandoz.
All three failed to get the FDA nod for their generic versions of Advair, a drug used in the management of asthma and chronic obstructive pulmonary disease that generated sales worth US $4.431 billion (£3.130 billion) in 2017.
Top 15 drugs by sales
Here is PharmaCompass’ compilation
of the best-selling drugs of 2017. This is based on information extracted from
annual reports and US Securities and Exchange Commission (SEC) filings of major
pharmaceutical companies.
If you would like your own copy of all the information we’ve collected, email us at support@pharmacompass.com and we’ll send you an Excel version.
Click here to access all the 2017 data (Excel
version available) for FREE!
S. No.
Company / Companies
Product Name
Active Ingredient
Main Therapeutic Indication
2017 Revenue in Millions (USD)
1
AbbVie Inc., Eisai
Humira®
Adalimumab
Immunology (Organ Transplant, Arthritis etc.)
18,946
2
Amgen, Pfizer Inc., Takeda
Enbrel®
Etanercept
Immunology (Organ Transplant, Arthritis etc.)
8,262
3
Regeneron, Bayer
Eylea
Aflibercept
Ophthalmology
8,260
4
Celgene
Revlimid
Lenalidomide
Oncology
8,187
5
Roche
MabThera®/Rituxan®
Rituximab
Oncology
7,831
6
Johnson & Johnson, Merck, Mitsubishi Tanabe
Remicade®
Infliximab
Autoimmune Disorders
7,784
7
Roche
Herceptin®
Trastuzumab
Oncology
7,435
8
Bristol-Myers Squibb, Pfizer Inc.
Eliquis®
Apixaban
Cardiovascular Diseases
7,395
9
Roche
Avastin®
Bevacizumab
Oncology
7,089
10
Bayer, Johnson & Johnson
XareltoTM
Rivaroxaban
Cardiovascular Diseases
6,590
11
Bristol Myers Squibb, Ono Pharmaceutical
Opdivo
Nivolumab
Oncology
5,815
12
Sanofi
Lantus
Insulin Glargine
Diabetes
5,731
13
Pfizer Inc.
Prevnar 13/Prevenar 13
Pneumococcal 7-Valent Conjugate
Anti-bacterial
5,601
14
Pfizer Inc., Eisai
Lyrica
Pregabalin
Neurological/Mental Disorders
5,318
15
Amgen, Kyowa Hakko Kirin
Neulasta®
Pegfilgrastim
Blood Disorders
4,553
Sign up, stay ahead
In order to stay informed, and receive
industry updates along with our data compilations, do sign up for the PharmaCompass Newsletter and
you will receive updated information as it becomes available along with a lot
more industry analysis.
Click here to Access All
the 2017 Data (Excel version available) for FREE!
Impressions: 58406
This week, Phispers brings you news on GSK, whose new CEO is planning a slew of initiatives to make the British drug giant more competitive. This means more challenges for Luke Miels, AstraZeneca CEO Pascal Soriot’s former deputy who is joining GSK as head of pharma division. Soriot, on the other hand, put all rumors to rest in a memo to his staff. In other news, Donald Trump unveiled a glass vial project that will create more jobs in America. And Teva announced job cuts in Israel. While Momenta-Sandoz lost a case to Amphastar.
GSK overhaul begins under new CEO; AZ’s Soriot puts (Teva) rumors to rest in a memo
Pascal Soriot, chief
executive of AstraZeneca, put all rumors to rest and told his
staff that he expects to work together with them and see the company succeed. A report in the Israeli media earlier this month had
said Soriot was in talks to join Teva. Last week, PharmaCompass reported
that Soriot had dropped the offer.
Though he did not mention Teva, in a memo, Soriot said: “Together, we are poised to achieve something remarkable and that few thought possible…Nothing can break the momentum you have established, and certainly not rumors.”
Soriot
is reportedly attending the European Society for Medical Oncology (ESMO)
annual meeting in Madrid in September, in case AstraZeneca has its clinical
data on its new immunotherapy medicine ready to present at the event.
Meanwhile, Soriot’s deputy, Luke Miels, is joining GlaxoSmithKline as head of its pharma
division. And if news reports are to be believed, employees are going to need courage to work under the Emma Walmsley,
the new CEO of the British drug giant.
Walmsley is looking for ways to make GSK more competitive. And in order to achieve that, she is pushing some functions and a lot of accountability into GSK’s three divisions. Their leaders will own the successes, as well as any failures.
According
to news reports, GSK is selling its Horlicks brand in the UK, shutting the Slough plant
where the malt drink is made and is abandoning a proposed US$ 457 million (£350 million) biopharmaceutical manufacturing plant in Cumbria.
Walmsley
also wants to improve drug research productivity, and wants GSK to have fewer but potentially more lucrative new drug launches in
the future. GSK is planning on scrapping more than 30 drug development programs and will focus 80
percent of its R&D budget on the top candidates in four therapeutic areas
and potentially exit the rare disease space.
Momenta-Sandoz lose case to Amphastar; AbbVie to
pay US$ 150m in damages
In
the US, Amphastar Pharmaceuticals won a case in a federal court against Momenta
Pharmaceuticals Inc and its partner Novartis AG’s Sandoz unit. The two had sought nearly
US$ 940 million in damages against Amphastar.
Momenta
and Sandoz had filed the lawsuit in 2011 after the US Food and Drug Administration (USFDA) had approved Amphastar’s generic version of Sanofi’s blockbuster Lovenox, an anticoagulant used to treat and
prevent blood clots.
The
two companies had accused Amphastar of infringing on a patent held by them,
through the production of a generic version of the blood-thinner Lovenox.
In
a statement, Momenta CEO Craig Wheeler said the company was disappointed and was considering its options, including a potential appeal. “We continue to believe in the importance of investing in innovative techniques for bringing products to market and protecting those innovations from unauthorized use,” he said.
Momenta
and Sandoz suffered a major setback earlier this year when Pfizer’s fill/finish manufacturing facility in
McPherson, Kansas, received a warning letter from the USFDA. The compliance
concern had been initially revealed by Momenta in a press statement as the
company, in collaboration with Sandoz, is developing a generic version of Teva’s
long-acting Copaxone® 40mg/mL (glatiramer acetate injection). Sandoz had tied up with Pfizer as its fill/finish manufacturing
partner.
Copaxone generated US$ 4.22 billion in sales last year.
Meanwhile,
a federal jury in Chicago found AbbVie Inc fraudulently misrepresented the risks of its testosterone replacement drug — AndroGel. The jury ordered AbbVie to pay US$ 150 million in punitive
damages.
A
lawsuit had been filed in 2014 against AbbVie by Jesse Mitchell and his wife.
The decision in the Mitchell case is the first in a series of test trials aimed
at helping plaintiffs and manufacturers of AndroGel assess the range of damages
and define a legal strategy and settlement options for such trials.
The jury said AbbVie was not “negligent or strictly liable” for a heart attack Mitchell suffered after taking AndroGel. However, it said AbbVie falsely marketed the drug. And, it did not award Mitchell compensatory damages for his injuries and losses.
Trump unveils glass vial project that is likely to
create 4,000 jobs in the US
Last
week, the US President Donald Trump announced an initiative to manufacture a
new kind of glass for injectable drug vials. Corning Inc is making a US$ 500 million
investment along with pharma giants Merck and Pfizer to manufacture these vials, which are
likely to create nearly 1,000 jobs at facilities in New York and New Jersey and another ‘yet to be announced’ site in southeastern USA.
This initiative was part of Trump's ‘Made in America’ week, during which he showcased America-made products. Trump also defended his administration’s ‘America First’ policies. He was joined by the
CEOs of Corning, Merck and Pfizer.
Trump said the deal could eventually result in a total investment of US$ 4 billion and create around 4,000 jobs. “This initiative will bring a key industry to our shores that for too long has been dominated by foreign countries. We’re moving more and more companies back into the United States,” Trump said.
According
to Trump, the glass is called Valor Glass and is a “substantial improvement” in
quality over existing products. It has superior strength and is more
damage-resistant.
In Israel, Teva pulls out the job axe; Japan’s Mitsubishi Tanabe buys Neuroderm
Teva
Pharmaceutical Industries recently announced that it is beginning negotiation
with the labor groups in Israel. It is expected to cut 300 to 350 workers and managers at production sites in
Histadrut and Ramat Hovav in the coming months.
This move will be yet another step towards Teva’s restructuring and business focus, aimed at bolstering the competitiveness of its sites in Israel.
Post
this announcement, Histadrut called a work dispute, which will permit employees
to strike in 14 days time. Teva currently has 7,000 employees in Israel.
Histradrut spokesman Yaniv Levy said: “We will not accept any unilateral measure in which workers are laid off at Teva. We expect the company’s management to act responsibly, and not to involve Teva’s plants in Israel in a series of conflicts that will escalate labor relations.”
Meanwhile,
Japan's Mitsubishi Tanabe Pharma has agreed to buy Israeli drug maker
Neuroderm for US$
1.1 billion in cash as part of a strategy to grow its business in the US.
Mitsubishi Tanabe said it is particularly attracted by Neuroderm’s Parkinson’s disease drug that is in advanced clinical trials in the US and Europe and is likely to be launched in 2019.
A minor molecule twist could be the
solution to cancer that killed Steve Jobs
Last
week, a nuclear medicine targeted at the type of cancer that killed former
Apple Inc co-founder and CEO Steve Jobs got a nod from the European Medicines
Agency (EMA), boosting prospects for its developer — Advanced Accelerator Applications (AAA).
The EU drugs regulator said its Committee for Medicinal Products for Human Use (CHMP) had recommended the product — Lutathera (lutetium 177 dotatate). This emerging treatment targets gastroenteropancreatic neuroendocrine tumors (GEP-NETs), including foregut, midgut, and hindgut neuroendocrine tumors in adults. The drug is likely to get a full approval in the coming two months.
Stefano Buono, chief executive officer of AAA, said
the company was also ready to re-file its application for US marketing approval
with the USFDA this month.
This French biotech company has described the new drug as a “multi-hundred million” dollar opportunity. Lutathera has the potential to transform AAA’s fortunes.
Buono’s AAA, which was spun off from Europe’s physics research centre CERN 15 years ago, had sales from existing diagnostic products of US$ 34.9 million in the first quarter of 2017. Lutathera is unusual in harnessing the same molecule that is already used to diagnose cancer to also deliver treatment.
After Celgene, Cardinal Health pulls out of China due to regulatory concerns
After Celgene
decided to reduce its footprint in China earlier this month, in order to
support only its clinical development and regulatory affairs activities in the
country, this week we heard about US drug distributor Cardinal Health putting its
China business on the block.
As per news reports, state-backed Chinese pharma companies
have evinced interest in a deal that may be worth up to US$ 1.5 billion. Shanghai Pharmaceutical, China Resources Pharmaceutical, and Sinopharm are
among those evincing interest in buying Cardinal Health, one of China’s largest drug distributors.
Ohio-based Cardinal wants to exit the country due to concerns around China's upcoming drug distribution reform, which is likely to slow down its growth. Cardinal has also been diversifying — in April it announced a US$ 6.1 billion deal for Medtronic Plc’s medical supplies units.
It has reportedly hired Lazard as an adviser for the China sale and the first
round of bidding is due later this week.Meanwhile, Celgene is offloading its Chinese operations to
the biopharmaceutical major Beigene. It is also giving Beigene the rights to Abraxane, Revlimid and Vidaza in China. This way, Beigene will assume responsibility for making and selling the approved drugs, along with Celgene’s pipeline prospect CC-122 in China. Celgene had also announced that it would buy a stake in BeiGene to help
develop and commercialize the China-based cancer immunotherapy developer's
treatment for solid tumor cancers, expanding its position in the field of
immuno-oncology. When the deal closes in the third quarter of this year,
Beigene will instantly become a commercial-stage biotech.
Impressions: 2909
The year 2016 finished with a whimper insofar as mergers and acquisitions (M&As) were concerned. The preceding year — 2015 — had gone down in history as a record year for M&As in the pharmaceutical and biotech space, when deals worth US $300 billion were announced.
While drug companies were not as active on
the M&A front, the product sales growth in 2016 continued to stay extremely
robust and the order of the top ranked drugs changed little from the previous
year.
This week, PharmaCompass brings you
a compilation of the top drugs of 2016 by sales revenue.
Click here to Access All the
2016 Data (Excel version available) for FREE!
The top-sellers
Abbvie’s Humira (adalimumab) continued to remain the best-selling drug in the
world and added another US $2 billion to its 2015 sales by generating record
sales of US $16.078 billion in 2016.
Last year also saw the US Food and Drug Administration (FDA) approve Amgen’s Amjevita™ (adalimumab – atto) — a biosimilar of Humira®. Amjevita was approved for treating adults with a variety of medical conditions ranging from rheumatoid arthritis, plaque psoriasis, to ulcerative colitis.
Click here to Access All the
2016 Data (Excel version available) for FREE!
Gilead’s Harvoni (ledipasvir and sofosbuvir), with record sales of US $13.864 billion in 2015, had a slightly muted performance in 2016 as sales fell to US $9.081 billion (a drop of US $4.783 billion). Gilead failed to maintain its initial rate of new prescriptions, and competition from Merck and AbbVie forced it to offer major discounts to health insurers.
While Gilead executives still believe there is lots of growth left in the hepatitis C market, this year Gilead will continue to face headwinds as Merck's new combination pill — Zepatier — entered the market with a list price at US $54,600 for a 12-week regimen, well below the US $94,500 for Harvoni.
Biological drugs, Enbrel (etanercept),
Remicade (infliximab) and MabThera (rituximab), held onto their positions of 2015, although their combined sales increased a little over US $300
million.
This means that for yet another year, the
four best-selling drugs in the world are from biological origin.
Celgene’s Revlimid (lenalidomide) — a thalidomide derivative introduced in 2004 as an immunomodulatory agent for the treatment of various cancers such as multiple myeloma — brought in US $5.8 billion in 2015, and grew another 20 percent this year, to US $6.974 billion. Revlimid now contributes more than 60 percent to the company's total sales of US $11.229 billion.
With almost identical sales of US $6.7
billion, Roche’s cancer treatments Herceptin and Avastin were also into
the top 10 best selling drugs in 2016, making Roche have the most number of
products, three of which made it to the list.
Click here to Access All the
2016 Data (Excel version available) for FREE!
Facing onslaught of generics, biosimilars
Against the backdrop of questions being raised about
insulin pricing and possible collusion in the United States, Sanofi saw its insulin treatment Lantus (insulin glargine) drop from number six on the 2015 list to number 9 in 2016 as sales fell by US $717 million to a little over US $6 billion. Sanofi’s competitors in the diabetes space — Novo Nordisk and Eli Lilly — also registered a drop in their insulin sales.
In addition to the pricing pressure, Sanofi will continue to contend with Lilly and Boehringer Ingelheim’s FDA approved biosimilar of insulin glargine — Basaglar — which was approved in December 2015.
Click here to Access All the
2016 Data (Excel version available) for FREE!
Basaglar is biologically similar to Sanofi’s Lantus and was announced at a price 15 percent lower than that of Lantus.
GSK’s Advair, which is preparing for generic competition in 2017, saw its sales drop 5 percent in British Pounds to £3,485. However, the dollar value was significantly lower in view of the fall in the Pound’s value after Brexit.
AstraZeneca’s Crestor (rosuvastatin calcium), Otsuka’s Abilify (aripiprazole) and Novartis’ Gleevec (imatinib) all saw their sales crash in 2016 as a result of generic onslaught. The three drugs together witnessed a combined sales drop of US $5.7 billion.
Top 20 drugs by sales
Here is PharmaCompass’ compilation
of the best-selling drugs of 2016. This is based on information extracted from
annual reports and US Securities and Exchange Commission (SEC) filings of major
pharmaceutical companies.
If you would like your own copy of all the information we’ve collected, email us at support@pharmacompass.com and we’ll send you an Excel version.
Click
here to access all the 2016 data (Excel version available) for FREE!
S. No
Product
Active Ingredient
Main Therapeutic Indication
Company
2016 Revenue in Millions (USD)
2015 Revenue in Millions (USD)
Sales Difference in Millions (USD)
1
Humira
Adalimumab
Immunology (Organ Transplant, Arthritis etc.)
Abbvie
16,078
14,012
2,066
2
Harvoni
Ledipasvir and Sofosbuvir
Infectious Diseases (HIV, Hepatitis etc.)
Gilead
9,081
13,864
(4,783)
3
Enbrel
Etanercept
Immunology (Organ Transplant, Arthritis etc.)
Amgen/Pfizer Inc.
8875
8697
178
4
Remicade
Infliximab
Immunology (Organ Transplant, Arthritis etc.)
Johnson & Johnson/Merck & Co
8,234
8,355
(121)
5
MabThera/Rituxan
Rituximab
Oncology
Roche
7227
6974.55
252
6
Revlimid
Lenalidomide
Oncology
Celgene
6,974
5,801
1,173
7
Avastin
Bevacizumab
Oncology
Roche
6,715
6,617
98
8
Herceptin
Trastuzumab
Oncology
Roche
6,714
6,473
242
9
Lantus
Insulin Glargine
Diabetes
Sanofi
6,057
6,773
(717)
10
Prevnar/Prevenar
13
Pneumococcal 13-Valent Conjugate
Anti-bacterial
Pfizer Inc.
5,718
6,246
(528)
11
Xarelto
Rivaroxaban
Cardiovascular Diseases
Bayer/Johnson & Johnson
5,392
4,255
1,137
12
Eylea
Aflibercept
Ophthalmology
Regeneron Pharmaceuticals, Inc./Bayer
5,046
3,978
1,068
13
Lyrica
Pregabalin
Neurological/Mental Disorders
Pfizer Inc.
4,966
4,839
127
14
Neulasta
Pegfilgrastim
Blood Disorders
Amgen
4,648
4,715
(67)
15
Seretide/Advair
Salmeterol
Respiratory Disorders
GlaxoSmithKline
4,252
4,491
(239)
16
Copaxone
Glatiramer
Neurological/Mental Disorders
Teva
4,223
4,023
200
17
Sovaldi
Sofosbuvir
Infectious Diseases (HIV, Hepatitis etc.)
Gilead
4,001
5,276
(1,275)
18
Tecfidera
Dimethyl Fumarate
Neurological/Mental Disorders
Biogen
3,968
3,638
330
19
Januvia
Sitagliptin
Diabetes
Merck & Co
3,908
3,864
44
20
Opdivo
Nivolumab
Oncology
Bristol-Myers Squibb
3,774
942
2,832
Blockbusters in the making
With almost US $5 billion in sales, a 14 percent growth over the previous year, Pfizer’s Lyrica enjoyed its last year before generic competition enters the market as Generics (UK) Limited (Mylan) and Actavis Group PTC ehf won a patent challenge in the United Kingdom.
Lyrica generics are expected in the United
States in late 2018.
Click here to Access All the
2016 Data (Excel version available) for FREE!
As Abbvie’s Humira begins to face competition from Amgen, Abbvie’s US $21 billion buy of Pharmacyclics seems to be paying off. The Pharmacyclics buy was a way to get access to Imbruvica (ibrutinib), which generated total 2016 sales of US $3.083 billion — an increase of US $1.64 billion over the previous year.
Anticoagulants, Xarelto (rivaroxaban), Eliquis (apixaban), Pradaxa (dabigatran) all registered significant positive growth with a combined increase of almost US $ 2.75 billion.
Gilead and GSK’s combination HIV treatments — Genvoya and Triumeq — also reported sales increase of over a billion dollars each.
Sign up,
stay ahead
In order to stay informed, and receive
industry updates along with our data compilations, do sign up for the PharmaCompass
Newsletter and you will receive updated information as it becomes available
along with a lot more industry analysis.
Click here to Access All the
2016 Data (Excel version available) for FREE!
Impressions: 58546
In less than three weeks, Donald Trump will assume office as the
President of the United States. He has mentioned that he wants Medicare (a
national social insurance program) to directly negotiate the price it pays for prescription drugs.
Medicare provides health insurance to Americans aged 65 or more, who
have worked and paid into the system through the payroll tax. It also provides
health insurance to younger people with some disabilities or end-stage renal
disease and amyotrophic lateral sclerosis.
In 2015, Medicare provided health insurance to over 55 million Americans — including 46 million people aged 65 or more, and nine million younger people.
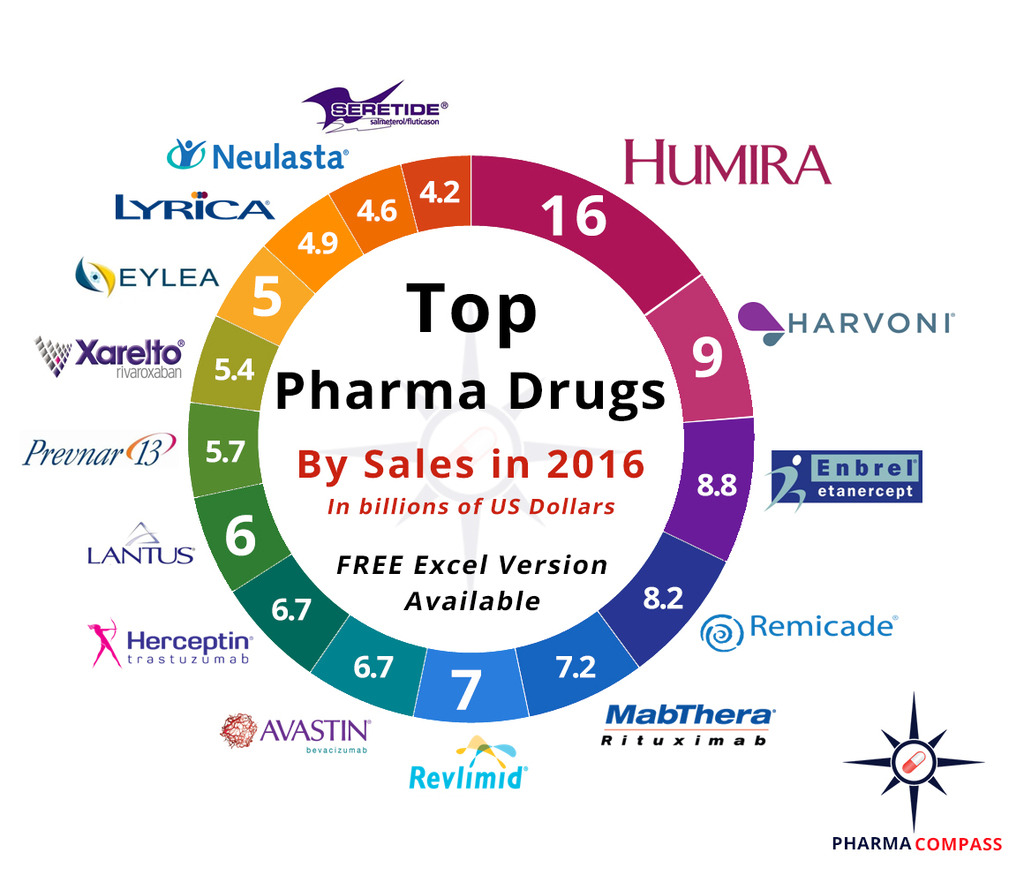
As we flag off the New Year, PharmaCompass
provides insights into drug prices and prescription patterns in the US in order
to help professionals make informed decisions. We believe that the cost of
medicines in the US, which have been a subject of much public outcry and
discussions in the recent years, will continue to be scrutinized during 2017.
Medicare data for 2014
Medicare Part D, also known as the Medicare prescription drug benefit — the program which subsidizes the costs of prescription drugs and prescription drug insurance premiums for Medicare beneficiaries — published a data set (for calendar year 2014) which contains information from over one million healthcare providers
who collectively prescribed approximately US $121 billion worth of prescription
drugs paid for under this program.
For each prescriber and drug, the dataset
includes the total number of prescriptions that were dispensed (including
original prescriptions and any refills), and the total drug cost.
The total drug cost includes the ingredient cost of the medication, dispensing fees, sales tax, and any applicable administration fees. It’s based on the amounts paid by the Part D plan, the Medicare beneficiary, other government subsidies, and any other third-party payers (such as employers and liability insurers).
The total drug cost does not reflect any manufacturer rebates paid to Part D plan sponsors through direct and indirect remuneration or point-of sale rebates. In order to protect the beneficiary’s privacy, the Centers for Medicare & Medicaid Services (CMS) did not
include information in cases where 10 or fewer prescriptions were dispensed.
Top
Ten Drugs by Cost, 2014 [Most expensive for Medicare]
Drug Name
Total Claim Count
Beneficiary Count
Prescriber Count
Total Drug Cost
Sofosbuvir
109,543
33,028
7,323
$3,106,589,192
Esomeprazole Magnesium
7,537,736
1,405,570
286,927
$2,660,052,054
Rosuvastatin Calcium
9,072,799
1,752,423
266,499
$2,543,475,142
Aripiprazole
2,963,457
405,048
130,933
$2,526,731,476
Fluticasone/Salmeterol
6,093,354
1,420,515
281,775
$2,276,060,161
Tiotropium Bromide
5,852,258
1,211,919
253,277
$2,158,219,163
Lantus
Solostar
(Insulin Glargine)
4,441,782
972,882
224,710
$2,016,728,436
Sitagliptin Phosphate
4,495,964
789,828
190,741
$1,775,094,282
Lantus
(Insulin Glargine)
4,284,173
787,077
223,502
$1,725,391,907
Lenalidomide
178,373
27,142
9,337
$1,671,610,362
View the Medicare Part D National Prescriber Summary Report, Calendar Year 2014 (Excel version available) for FREE!
Top
Ten Drugs by Average Cost per Claim, 2014 [Most expensive drugs]
Drug Name
Total Claim Count
Beneficiary Count
Prescriber Count
Total Drug Cost
Average Cost Per Claim
Adagen
13
$1,224,835
$94,218
Elaprase
100
$6,560,225
$65,602
Cinryze
1,820
194
196
$96,155,785
$52,833
Carbaglu
60
$2,901,115
$48,352
Naglazyme
129
$6,189,045
$47,977
Berinert
538
73
68
$25,685,311
$47,742
Firazyr
1,568
269
232
$70,948,143
$45,248
H.P. Acthar
9,611
2,932
1,621
$391,189,653
$40,702
Procysbi
314
41
47
$12,542,911
$39,946
Folotyn
15
$598,210
$39,881
Top
Ten Drugs by Claims, 2014 [Most Commonly Used by Patients]
Generic Name
Total Claim Count
Beneficiary Count
Prescriber Count
Total Drug Cost
Lisinopril
38,278,860
7,454,940
464,747
$281,614,340
Levothyroxine Sodium
37,711,869
6,245,507
416,518
$631,855,415
Amlodipine Besylate
36,344,166
6,750,062
451,350
$303,779,661
Simvastatin
34,092,548
6,768,159
387,651
$346,677,118
Hydrocodone-Acetaminophen
33,446,696
8,005,790
677,865
$676,296,988
Omeprazole
33,032,770
6,707,964
475,122
$529,050,385
Atorvastatin Calcium
32,603,055
6,740,061
419,327
$747,635,818
Furosemide
27,133,430
5,176,582
456,047
$135,710,772
Metformin HCl
23,475,787
4,509,978
364,273
$203,948,989
Gabapentin
22,143,641
4,298,609
486,754
$492,557,255
View the Medicare Part D National Prescriber Summary Report, Calendar Year 2014 (Excel version available) for FREE!
Top
Ten Drugs by Prescribers, 2014 [Most Popular with Doctors]
Generic Name
Total Claim Count
Beneficiary Count
Prescriber Count
Total Drug Cost
Hydrocodone/Acetaminophen
33,446,696
8,005,790
677,865
$676,296,988
Ciprofloxacin HCl
7,253,018
4,926,835
568,201
$46,728,353
Amoxicillin
6,298,980
4,384,899
557,614
$31,193,739
Cephalexin
5,040,219
3,529,303
557,048
$36,987,401
Azithromycin
7,339,954
5,274,010
544,625
$70,699,119
Prednisone
11,032,986
4,505,821
536,108
$86,537,932
Tramadol HCl
14,250,227
4,272,724
515,816
$125,343,514
Sulfamethoxazole /Trimethoprim
4,833,758
3,090,944
500,790
$29,231,511
Gabapentin
22,143,641
4,298,609
486,754
$492,557,255
Amoxicillin/Potassium Clav
3,551,452
2,710,244
478,361
$61,713,432
The findings from CMS
data
The CY 2014 data represented a 17 percent
increase compared to the 2013 data set and a substantial part of the total estimated prescription drug spending (as estimated by the Department of Health and Human Services Office of the Assistant Secretary for Planning and Evaluation, or ASPE) in the United States — at about US $ 457 billion in 2015, which was 16.7 percent of the overall personal healthcare services.
Of that US $ 457 billion, US $ 328 billion (71.9 percent) was for retail
drugs and US $ 128 billion (28.1 percent) was for non-retail drugs.
The drug pricing process in the US is complex and
reflects the influence of numerous factors, including manufacturer list prices,
confidential negotiated discounts and rebates, insurance plan benefit designs,
and patient choices.
An IMS study found that across 12 therapy classes widely used in Medicare Part D,
medicine costs to plans and patients in Medicare Part D are 35 percent below
list prices.
View the Medicare Part D National Prescriber Summary Report, Calendar Year 2014 (Excel version available) for FREE!
While the CMS does not
currently have an established formulary, Part D drug coverage excludes drugs
not approved by the US Food and Drug Administration, those prescribed for off-label
use, drugs not available by prescription for
purchase in the US, and drugs for which payments would be available under Parts
A or B of Medicare.
Part D coverage
excludes drugs or classes of drugs excluded from Medicaid coverage,
such as:
Drugs used for anorexia, weight loss, or weight gain
Drugs used to promote fertility
Drugs used for erectile dysfunction
Drugs used for cosmetic purposes (hair growth, etc.)
Drugs used for the symptomatic relief of cough and colds
Prescription vitamins and mineral products, except prenatal vitamins and fluoride preparations
Drugs where the manufacturer requires (as a condition of sale) any associated tests or monitoring services to be purchased exclusively from that manufacturer or its designee
Our view
The Medicare program is designed such that the
federal government is not permitted to negotiate prices of drugs with the drug
companies, as federal agencies do under other programs.
For instance, the Department of Veterans Affairs — which is allowed to negotiate drug prices and establish a formulary — has been estimated to pay (on an average) between 40 to 58 percent less for drugs, as opposed to Medicare Part D.
If Trump administration kick starts direct
negotiations on Medicare drug prices with drug companies, 2017 will surely turn
out to be a year for the pharmaceutical industry to remember.
View the Medicare Part D National Prescriber Summary Report, Calendar Year 2014 (Excel version available) for FREE!
Impressions: 7923
The year 2015 has gone down
in history as a record year for mergers and acquisitions in the pharmaceutical
and biotech space with deals worth US $ 300 billion being announced. The highlight
of the year was the Pfizer-Allergan mega-merger – the biggest-ever pharma transaction worth more than US $ 160 billion.
Pharma Letter tracked transactions
through the year and found the number of deals exceeding US $1 billion at 30 in
2015, as compared to 26 in 2014 and 20 in 2013. In all, a total of 166 M&A
deals were announced in 2015 (out of which some are yet to be completed),
compared to 137 in 2014.
This week, PharmaCompass
brings you a compilation of the top drugs of 2015 by sales revenue and growth.
Sofosbuvir – the outright winner of 2015
2015 was the year of Sofosbuvir – the revolutionary active ingredient used for the treatment of hepatitis. Together, through the sale of drugs Harvoni and
Sovaldi, Sofosbuvir brought in sales of almost US $ 19 billion.
The PharmaCompass prediction
that Harvoni (a combination of Ledipasvir and Sofosbuvir; and used for the treatment
of infectious diseases like hepatitis and HIV) would become the best-selling
drug ever in 2015 fell slightly short of expectations as its sales of US $ 13.864
billion were marginally less than AbbVie’s rheumatoid arthritis treatment – Humira.
Humira retained its place as the best-selling drug with US $
14.012 billion in sales in 2015. However, with sales growth of US $ 11.737
billion in a single year, Harvoni is poised to become the best-selling drug by
the end of 2016.
Top 20 Drugs by Sales
Here is PharmaCompass’ compilation of the best-selling drugs of 2015. This is based on information
extracted from annual reports and US Securities and Exchange Commission (SEC) filings
of major pharmaceutical companies.
If you would like your own copy of all the information we’ve collected, email us at support@pharmacompass.com and we’ll send you an Excel version.
Click here to access all
the 2015 data (Excel version available) for FREE!
Product
Active Ingredient
Main Therapeutic Indication
Company
2014 Revenue in Millions
(USD)
2015 Revenue in Millions
(USD)
2015 Sales Difference
Millions (USD)
1
Humira
Adalimumab
Immunology (Organ Transplant, Arthritis etc.)
AbbVie
12,543
14,012
1,469
2
Harvoni
Ledipasvir
and Sofosbuvir
Infectious Diseases (HIV, Hepatitis etc.)
Gilead
Sciences
2,127
13,864
11,737
3
Enbrel
Etanercept
Immunology (Organ Transplant, Arthritis etc.)
Amgen / Pfizer
4,688
8,697
4009
4
Remicade
Infliximab
Immunology (Organ Transplant, Arthritis etc.)
Johnson
& Johnson / Merck
6,868
8,355
1487
5
MabThera/Rituxan
Rituximab
Oncology
Roche
5,659
7,115
1,456
6
Lantus
Insulin Glargine
Diabetes
Sanofi
6,978
7,029
51
7
Avastin
Bevacizumab
Oncology
Roche
6,481
6,751
270
8
Herceptin
Trastuzumab
Oncology
Roche
6,338
6,603
265
9
Revlimid
Lenalidomide
Blood Related Disorders
Celgene
Corpoartion
4,980
5,801
821
10
Sovaldi
Sofosbuvir
Infectious Diseases (HIV, Hepatitis etc.)
Gilead
Sciences
10,283
5,276
(5,007)
11
Seretide / Advair
Salmeterol
Respiratory Disorders
GlaxoSmithKline
6,005
5,227
(778)
12
Crestor
Rosuvastatin
Calcium
Cardiovascular
AstraZeneca
5,512
5,017
(495)
13
Lyrica
Pregabalin
Neuroscience and Mental Health
Pfizer
Inc.
5,168
4,839
(329)
14
Neulasta
Pegfilgrastim
Blood Related Disorders
Amgen
4,596
4,715
119
15
Gleevec / Glivec
Imatinib
Oncology
Novartis
4,746
4,658
(88)
16
Xarelto
Rivaroxaban
Anticoagulants
Bayer / Johnson
& Johnson
3,369
4,345
976
17
Copaxone
Glatiramer
Neuroscience and Mental Health
Teva
4,237
4,023
(214)
18
Januvia
Sitagliptin
Diabetes
Merck
& Co
3,931
3,863
(68)
19
Abilify
Aripiprazole
Neuroscience and Mental Health
Bristol-Myers
Squibb/ Otsuka
Holdings
6,485
3,804
(2681)
20
Tecfidera
Dimethyl
Fumarate
Neuroscience and Mental Health
Biogen
2,909
3,638
729
Click here to access all
the 2015 data (Excel version available) for FREE!
A year of record FDA approvals
2015 was also the
year when the US Food and Drug Administration (FDA) approved 45 novel drugs, another
all-time record high. In January this year, PharmaCompass had compiled a list of novel drugs approved by the FDA in 2015. We also extensively covered the new dosage forms of existing drugs approved in 2015. Do go through the article published on January 14, 2016, for more information.
PharmaCompass’ compilation of sales forecasts of novel drugs indicated a significant
variation in estimates. However, in our view, drugs that
saw highest sales growth in 2015 are likely to do well this year as well.
Top 20 drugs by sales growth (in USD, millions)
Product
Active Ingredient
Main Therapeutic Indication
2014 Revenue in Millions
(USD)
2015 Revenue in Millions
(USD)
2015 Sales Difference
Millions (USD)
1
Harvoni
Ledipasvir
and Sofosbuvir
Infectious Diseases (HIV, Hepatitis etc.)
2,127
13,864
11,737
2
Viekira Pak
Ombitasvir/Paritaprevir/Ritonavir
Infectious Diseases (HIV, Hepatitis etc.)
48
1,639
1,591
3
Humira
Adalimumab
Immunology (Organ Transplant, Arthritis etc.)
12,543
14,012
1,469
4
Hepatits C Franchise
Daclatasvir and Asunaprevir
Infectious Diseases (HIV, Hepatitis etc.)
256
1,603
1,347
5
Imbruvica
Ibrutinib
Chronic lymphocytic leukemia
200
1,443
1,243
6
Cubicin
Daptomycin
Anti-bacterial
25
1,127
1,102
7
Eliquis
Apixaban
Anticoagulants
774
1,860
1,086
8
Triumeq
Abacavir, Dolutegravir and Lamivudine
Infectious Diseases (HIV, Hepatitis etc.)
-
1,037
1,037
9
Xarelto
Rivaroxaban
Anticoagulants
3,369
4,345
976
10
Opdivo
Nivolumab
Oncology
6
942
936
11
Revlimid
Lenalidomide
Blood Related Disorders
4,980
5,801
821
12
Tecfidera
Dimethyl
Fumarate
Neuroscience and Mental Health
2,909
3,638
729
13
Xtandi
Enzalutamide
Oncology
480
1,207
727
14
Ibrance
Palbociclib
Oncology
-
723
723
15
Invokana / Invokamet
Canagliflozin
Type 2 diabetes
586
1,308
722
16
Victoza
Liraglutide
Diabetes
2,014
2,704
690
17
Stribild
Cobicistat, Elvitegravir, Emtricitabine and Tenofovir
Disoproxil Fumarate
Infectious Diseases (HIV, Hepatitis etc.)
1,197
1,825
628
18
Levemir
Insulin
Diabetes
2,133
2,745
612
19
Votrient
Pazopanib
Oncology
565
565
20
Perjeta
Pertuzumab
Oncology
927
1459
532
Hepatitis C products, which had three
of the four highest sales growths in 2015, clearly show the impact these
revolutionary treatments will have on the global healthcare landscape in time
to come. Cancer immunotherapy treatments, a new generation of blood thinners
and novel diabetes treatments were some of the others which demonstrated stellar
growth in 2015.
Vaccines from Pfizer and Sanofi also displayed tremendous sales growth although they
have not been included in the compilation of drugs.
Click here to access all
the 2015 data (Excel version available) for FREE!
Sign Up, Stay Ahead
While some companies like Boehringer and Valeant are yet to release their annual reports. In order to
stay informed, do sign up for the PharmaCompass
Newsletter and you will receive updated information as it becomes available
along with a lot more industry analysis.
Click here to access all
the 2015 data (Excel version available) for FREE!
CORRECTION, April 12, 2016: An earlier version of this compilation
did not account for cases where the same drug is sold by multiple companies
(e.g. Enbrel, Remicade, Xarelto etc.). As an outcome, a re-ranking of the Top
20 Drugs by Sales and Sales Growth has been done.
Impressions: 56503