BLOG
MARKET INTEL by PharmaCompass
CONTENT by Suppliers
- Interview #SpeakPharma
- Video #SupplierSpotlight
- Vlog #PharmaReel
- Company Bio #AboutSupplier
- Services Bio #AboutCapabilities
News
Create content with us, ask us
By PharmaCompass
2018-07-05
Impressions: 2695
This week, PharmaCompass reviews the recently released data on prescription drugs paid for under the Medicare Part D Prescription Drug Program in the United States in calendar year 2016.
But first, let’s understand what is Medicare.
Medicare is the federal health insurance program in the US. In 2017, it covered 58.4 million people — 49.5 million aged 65 and older, and 8.9 million disabled.
Prescription drug coverage under this program was started in 2006, and is known as Medicare Part D.


As part of this coverage, the Centers for Medicare & Medicaid Services (CMS) contracts insurance companies and other private companies, known as plan sponsors, that offer prescription drug plans to their beneficiaries with varying drug coverage and cost-sharing requirements.
In 2017, the Congressional Budget Office (CBO) had estimated that spending on Medicare Part D would reach US$ 94 billion, or about 16 percent of all Medicare expenditures for the year.
Click here to access the compilation of Medicare Part D Prescriber Summary Report
According to the CBO, Medicare Part D is the most significant expansion of the Medicare program since it was created by Congress in 1965.
With more than 1.48 billion claims from beneficiaries enrolled under the Part D prescription drug benefit program under its umbrella, our analysis of Medicare Part D provides valuable insights into how elderly Americans use prescription drugs.
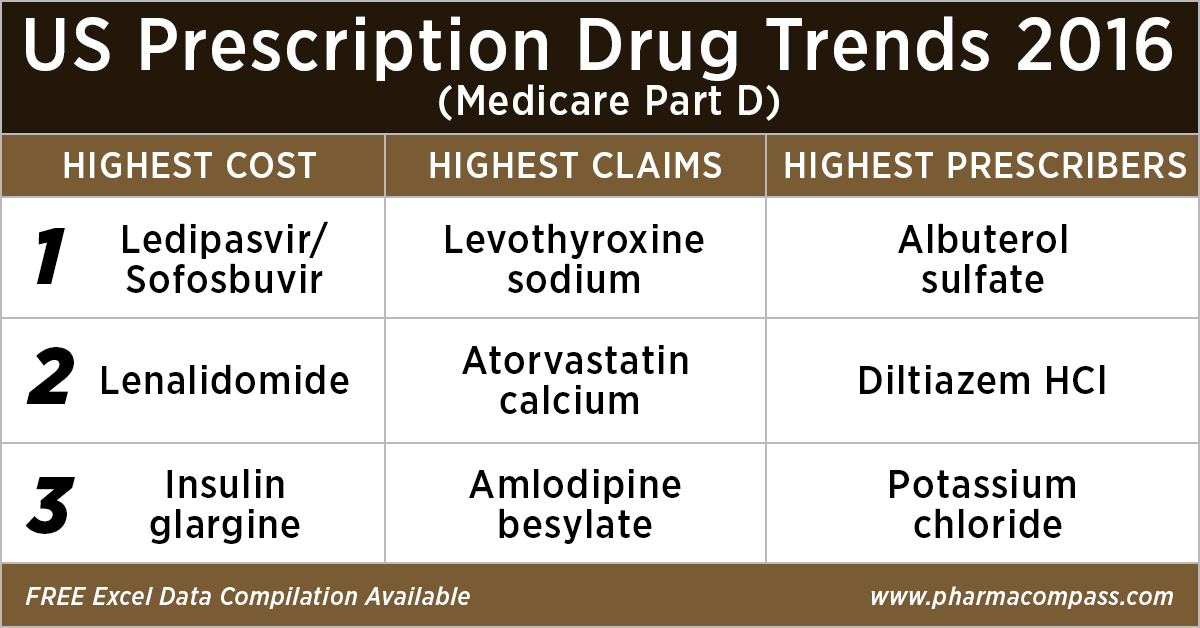
Top 10 drugs by
cost: The ones that bore the highest cost burden for Medicare
As in 2015, in 2016 too Gilead’s Hepatitis C treatment — Ledipasvir/Sofosbuvir (Harvoni) — remained the single drug highest payout under the Medicare Part D Prescription Drug Program with a total cost of US$ 4.4 billion.
As Gilead continued to face competition from AbbVie and Merck in the Hepatitis C space, the spending on Harvoni was down 37 percent from US$ 7.03 billion in 2015.
Click here to access the compilation of Medicare Part D Prescriber Summary Report
Celgene’s cancer treatment, Lenalidomide (Revlimid), Sanofi and Merck’s diabetes treatments and AstraZeneca’s Crestor (Rosuvastatin Calcium) for cholesterol followed Harvoni. All together, they cost the Medicare program over US$ 10 billion.
|
Generic Name |
Number of Medicare Part D Claims |
Number of Medicare Beneficiaries |
Number of Prescribers |
Aggregate Cost Paid for Part D Claims (In USD) |
|
LEDIPASVIR/ SOFOSBUVIR (HARVONI) |
141,665 |
52,782 |
12,097 |
4,398,534,465 |
|
LENALIDOMIDE |
239,049 |
35,368 |
10,382 |
2,661,106,127 |
|
LANTUS SOLOSTAR (INSULIN GLARGINE, HUM.REC.ANLOG ) |
5,028,485 |
1,075,248 |
245,447 |
2,526,048,766 |
|
SITAGLIPTIN PHOSPHATE |
4,742,505 |
864,442 |
206,223 |
2,440,013,513 |
|
ROSUVASTATIN CALCIUM |
6,012,444 |
1,560,050 |
249,981 |
2,322,724,007 |
|
FLUTICASONE/SALMETEROL |
5,194,391 |
1,196,007 |
275,442 |
2,319,808,482 |
|
PREGABALIN |
4,940,115 |
852,497 |
267,532 |
2,098,953,250 |
|
RIVAROXABAN |
4,403,332 |
807,820 |
252,141 |
1,954,748,890 |
|
APIXABAN |
4,455,782 |
826,969 |
231,631 |
1,926,107,484 |
|
TIOTROPIUM BROMIDE |
4,153,162 |
903,494 |
235,564 |
1,818,857,361 |
Top 10 drugs by claims: The most commonly
used drugs of 2016
With 46.6 million claims, the thyroid hormone deficiency treatment — Levothyroxine Sodium — retained its position of being the most claimed product under Medicare’s Part D Prescription Drug Program in 2016.
The number of Medicare Part D claims includes original prescriptions and refills.
Following Levothyroxine Sodium was the lipid-lowering agent — Atorvastatin Calcium — which had 44.5 million Medicare Part D claims that were filed by almost 9.4 million beneficiaries.
|
Generic Name |
Number of Prescribers |
Number of Medicare Part D Claims |
Number of Medicare Beneficiaries |
|
LEVOTHYROXINE SODIUM |
669,999 |
46,617,109 |
8,091,785 |
|
ATORVASTATIN CALCIUM |
494,973 |
44,595,686 |
9,435,633 |
|
AMLODIPINE BESYLATE |
497,017 |
39,913,468 |
7,802,905 |
|
LISINOPRIL |
490,452 |
39,469,840 |
8,009,954 |
|
OMEPRAZOLE |
492,951 |
32,909,236 |
7,001,160 |
|
METFORMIN HCL |
611,700 |
31,007,932 |
6,394,014 |
|
SIMVASTATIN |
380,560 |
29,687,947 |
6,201,911 |
|
HYDROCODONE/ACETAMINOPHEN |
660,617 |
28,595,150 |
7,265,882 |
|
FUROSEMIDE |
488,352 |
27,878,243 |
5,421,598 |
|
GABAPENTIN |
555,997 |
27,627,466 |
5,363,382 |
Click here to access the compilation of Medicare Part D Prescriber Summary Report
Top 10 drugs by prescribers: Medicines that were most popular with
doctors
Among the prescribers, albuterol sulfate (salbutamol) and Diltiazem had over 900,000 unique providers (or doctors) prescribing the drug.
Albuterol (salbutamol) is used to provide quick relief from wheezing and shortness of breath while Diltiazem is used to prevent chest pain (angina).
Also on the list of popular drugs with prescribers is Hydrocodone-Acetaminophen.
With more doctors prescribing Hydrocodone-Acetaminophen (an opioid) than commonly used antibiotics, such as Cephalexin, Ciprofloxacin and Amoxicillin, the series of new FDA initiatives to combat the epidemic of opioid misuse and abuse should change the position of opioids in the top 10 drugs by prescribers in the coming years.
Click here to access the compilation of Medicare Part D Prescriber Summary Report
|
Generic Name |
Number of Prescribers |
Number of Medicare Part D Claims |
Number of Medicare Beneficiaries |
|
ALBUTEROL SULFATE |
985,427 |
13,100,354 |
5,417,718 |
|
DILTIAZEM HCL |
931,159 |
8,142,004 |
1,982,550 |
|
POTASSIUM CHLORIDE |
879,491 |
18,945,969 |
4,278,000 |
|
PEN NEEDLE, DIABETIC |
677,210 |
5,281,778 |
1,795,046 |
|
LEVOTHYROXINE SODIUM |
669,999 |
46,617,109 |
8,091,785 |
|
HYDROCODONE/ACETAMINOPHEN |
660,617 |
28,595,150 |
7,265,882 |
|
METFORMIN HCL |
611,700 |
31,007,932 |
6,394,014 |
|
CEPHALEXIN |
597,647 |
5,603,879 |
3,933,373 |
|
CIPROFLOXACIN HCL |
594,129 |
7,000,081 |
4,851,657 |
|
AZITHROMYCIN |
591,028 |
7,958,625 |
5,734,122 |
What does the
future hold?
Although the Part D Prescriber PUF (public use file) has a wealth of information on payment and utilization for Medicare Part D prescriptions, the dataset has a number of limitations. Of particular importance is the fact that the data may not be representative of a physician’s entire practice or all of Medicare as it only includes information on beneficiaries enrolled in the Medicare Part D prescription drug program (i.e., approximately two-thirds of all Medicare beneficiaries).
Click here to access the compilation of Medicare Part D Prescriber Summary Report
Last month, the Office of the Inspector General (OIG) reviewed the Part D claims data for the years 2011 to 2015 for brand-name drugs.
The OIG’s report found that the total reimbursement for all brand-name drugs in Part D increased 77 percent from 2011 to 2015, despite a 17-percent decrease in the number of prescriptions for these drugs.
With soaring drug prices being an issue for regular debate in the Unites States and President Trump announcing that his team will use strategies to strengthen the negotiating powers under Medicare Part D and Part B, it remains to be seen how the data on prescription drugs paid for under the Medicare Part D Prescription Drug Program will change in the coming years.
Click here to access the compilation of Medicare Part D Prescriber Summary Report
The PharmaCompass Newsletter – Sign Up, Stay Ahead
Feedback, help us to improve. Click here
Image Credit : US Prescription Drug Trends 2016 by PharmaCompass is licensed under CC BY 2.0
“ The article is based on the information available in public and which the author believes to be true. The author is not disseminating any information, which the author believes or knows, is confidential or in conflict with the privacy of any person. The views expressed or information supplied through this article is mere opinion and observation of the author. The author does not intend to defame, insult or, cause loss or damage to anyone, in any manner, through this article.”