
X

API Suppliers

US DMFs Filed

CEP/COS Certifications
0

JDMFs Filed
Other Certificates
Other Suppliers
USA (Orange Book)
Europe

Canada

Australia

South Africa
Uploaded Dossiers
U.S. Medicaid
Annual Reports
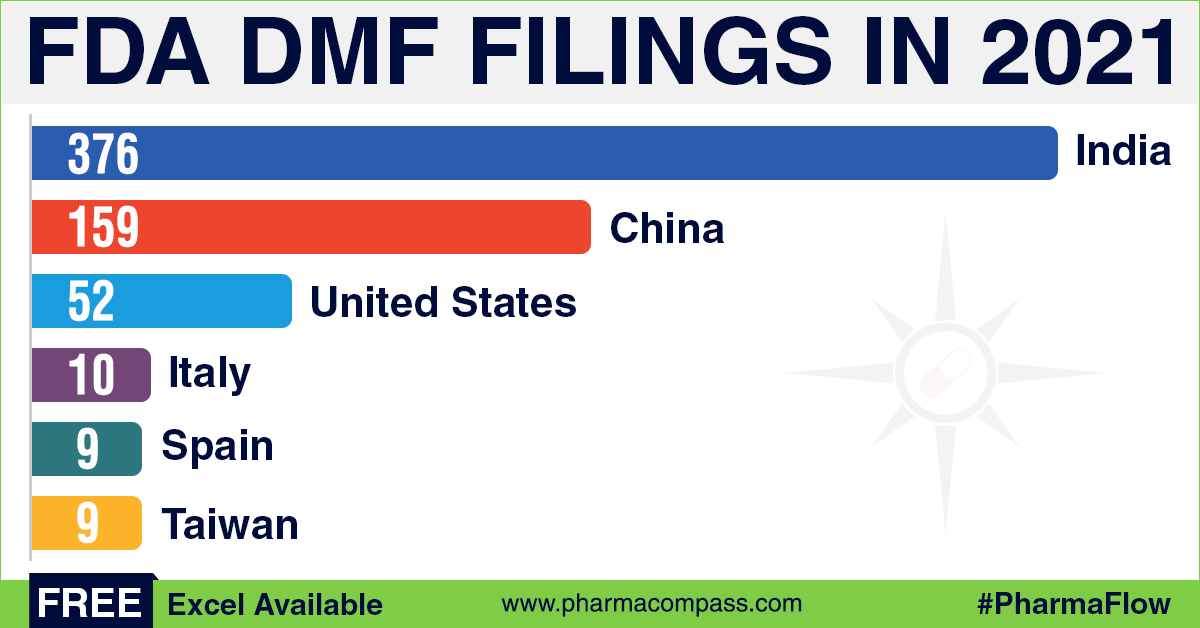
Impressions: 5380
https://www.pharmacompass.com/radio-compass-blog/dmf-submissions-in-2021-india-china-continue-to-top-filings
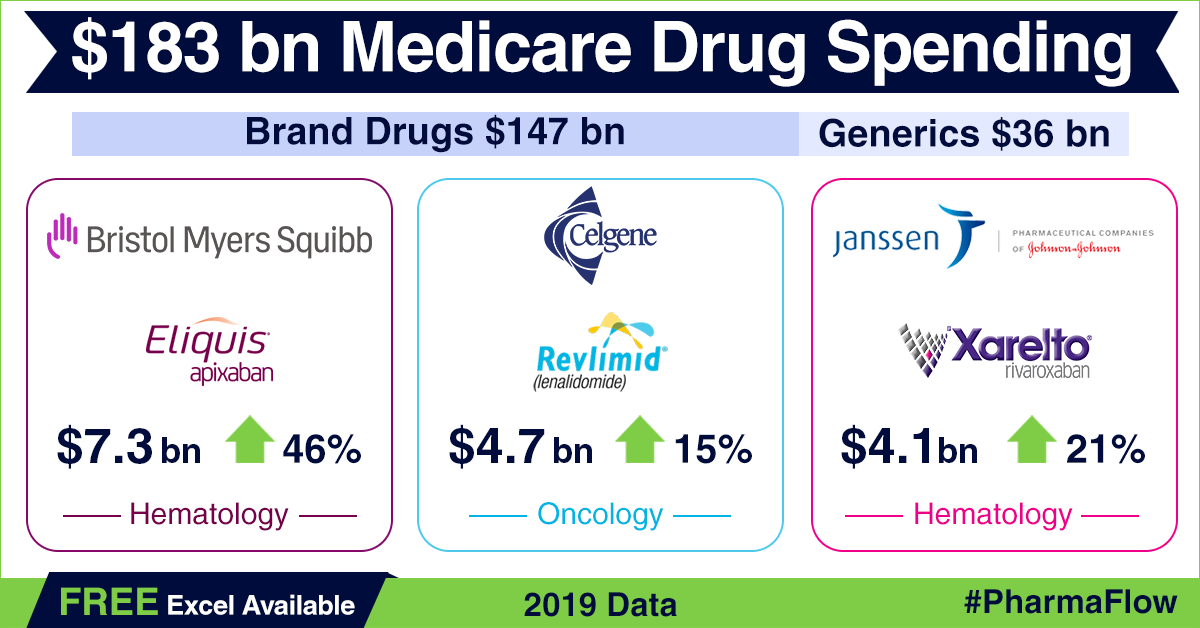
Impressions: 2622
https://www.pharmacompass.com/radio-compass-blog/america-s-drug-price-hike-conundrum-in-backdrop-of-2019-medicare-part-d-data
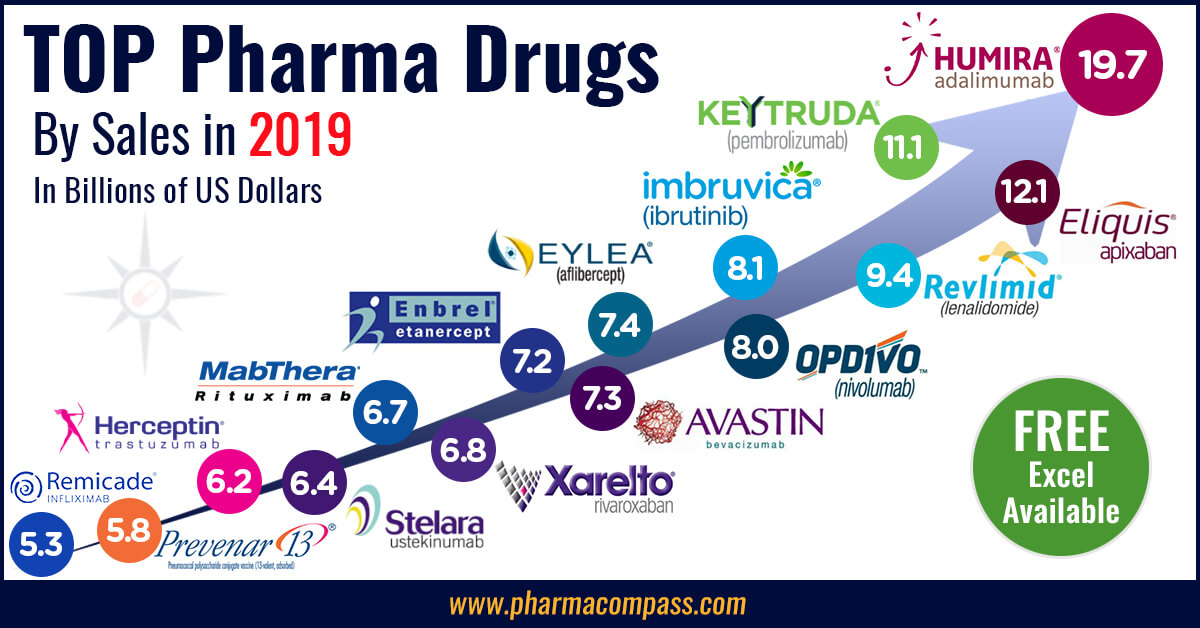
Impressions: 54752
https://www.pharmacompass.com/radio-compass-blog/top-drugs-and-pharmaceutical-companies-of-2019-by-revenues
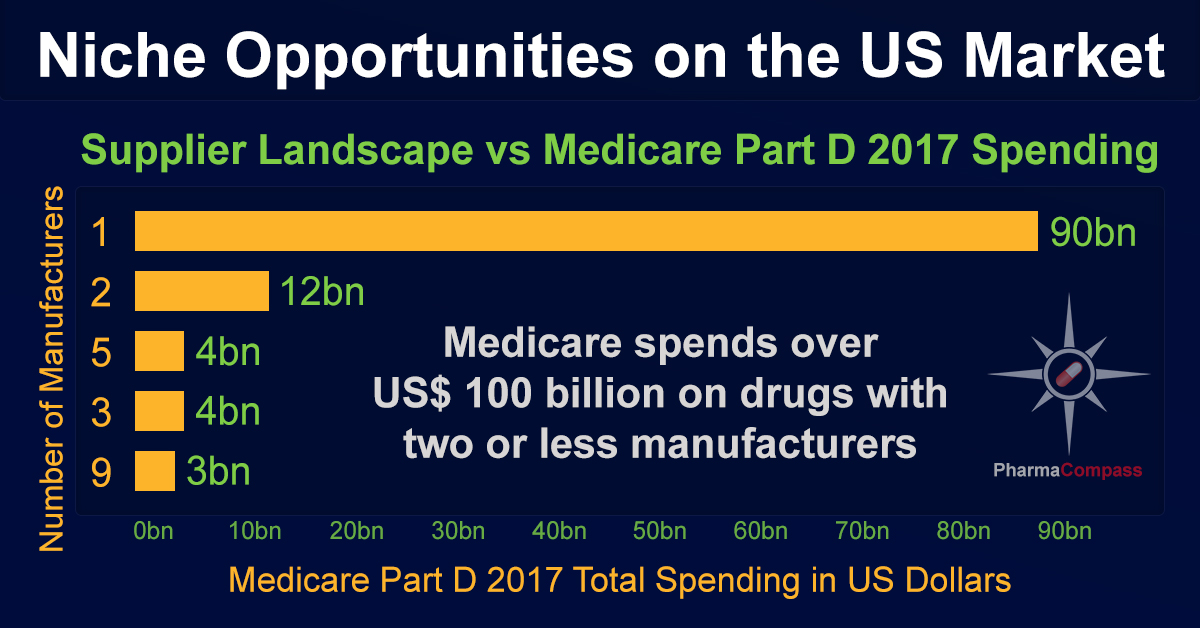
Impressions: 4699
https://www.pharmacompass.com/radio-compass-blog/us-market-offers-niche-opportunities-reveals-manufacturer-sales-data-from-medicare-part-d
Impressions: 2500
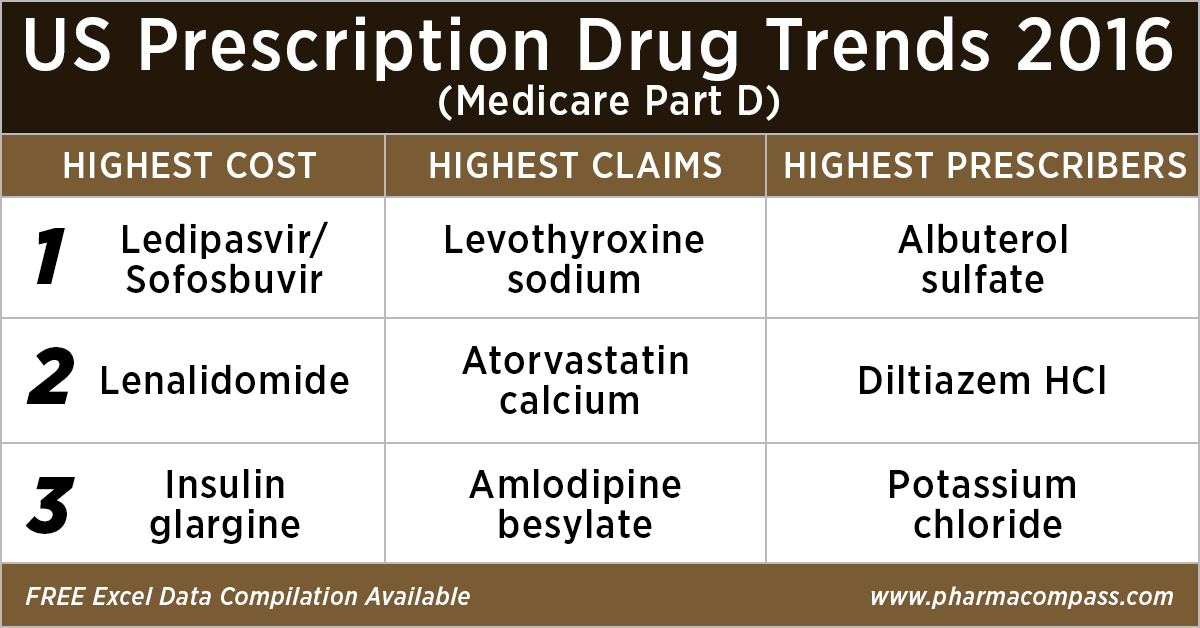
https://www.pharmacompass.com/radio-compass-blog/analyzing-over-us-90-billion-of-medicare-prescription-drug-part-d-spending-in-2016
Impressions: 58406
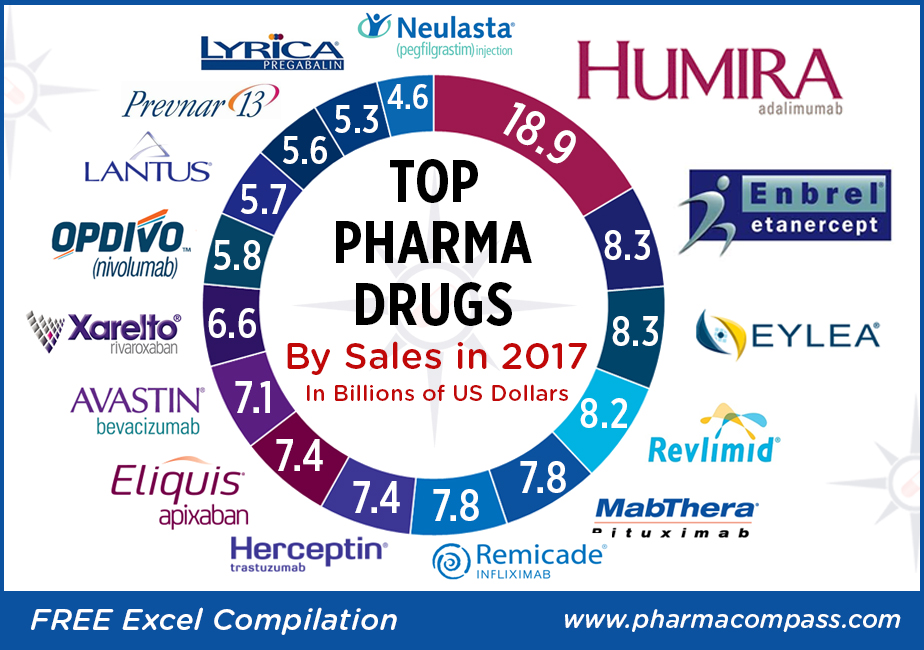
https://www.pharmacompass.com/radio-compass-blog/top-drugs-by-sales-in-2017-who-sold-the-blockbuster-drugs

Impressions: 2909
https://www.pharmacompass.com/radio-compass-blog/gsk-s-overhaul-begins-under-new-ceo-sandoz-loses-us-940-million-lawsuit
Impressions: 58546
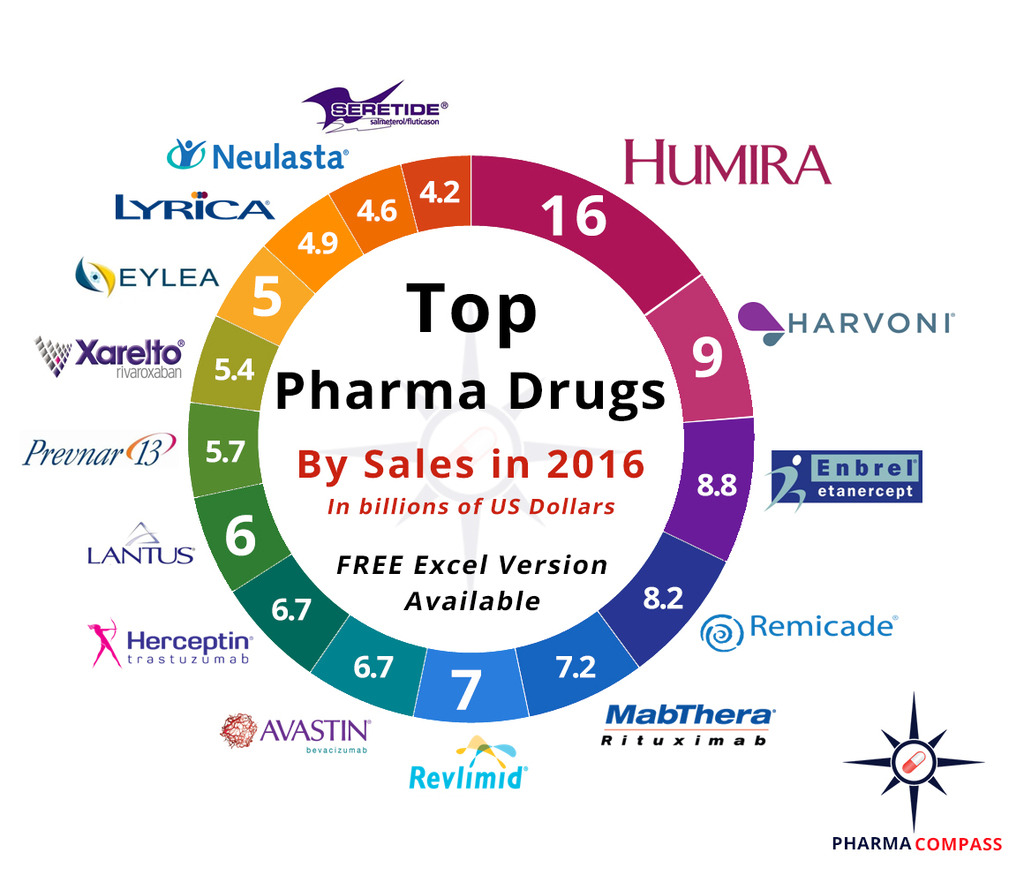
https://www.pharmacompass.com/radio-compass-blog/top-drugs-by-sales-in-2016-who-sold-the-blockbuster-drugs

Impressions: 7923
https://www.pharmacompass.com/radio-compass-blog/drug-costs-and-prescription-trends-in-the-united-states-analyzing-medicare-s-121-billion-spend

Impressions: 56503
https://www.pharmacompass.com/radio-compass-blog/top-drugs-by-sales-revenue-in-2015-who-sold-the-biggest-blockbuster-drugs