BLOG
MARKET INTEL by PharmaCompass
CONTENT by Suppliers
- Interview #SpeakPharma
- Video #SupplierSpotlight
- Vlog #PharmaReel
- Company Bio #AboutSupplier
- Services Bio #AboutCapabilities
News
Create content with us, ask us
By PharmaCompass
2020-09-30
Impressions: 56296
With so much talk about the high prices America pays for its drugs, and the US President Donald Trump signing the ‘America First Healthcare Plan’ days before the presidential debate with his democratic opponent Joe Biden, PharmaCompass thought it’s the right time to look at the top prescription drugs that America consumes. And also examine the total spend on prescription drugs, as a proportion of the overall healthcare spend in the US.
We look at America’s healthcare scenario with the help of two reports. The first report, known as the Medical Expenditure Panel Survey (MEPS), provides detailed information on household-reported prescribed medicines for a nationally representative sample of the civilian non-institutionalized population of the United States. The MEPS can be used to make estimates of prescribed medicine utilization, based on the expenditures for 2018.
This list of prescription drugs consumed by household members in the US in 2018 was published by the Department of Health & Human Services’ Agency for Healthcare Research and Quality (AHRQ). The data was released in July 2020 and does not include drugs administered in hospitals or provider offices.
The second report — Projections of the Non-Retail Prescription Drug Share of National Healthcare Expenditures — reveals a 10-year projection (2019-2028) of the national health expenditures (NHE) that includes prescription drugs. The study was funded by the Pharmaceutical Research and Manufacturers of America (PhRMA) and reviews the data brought out by the Centers for Medicare & Medicaid Services (CMS).
The CMS estimates show that retail spending on prescription drugs was at 9.2 percent of NHE in 2018 and is likely to fall to 9 percent by 2028. The CMS estimates non-retail drug spending on prescription drugs at an additional 4.5 percent of NHE in 2018. Non-retail drug spending consists of prescription drugs that are administered as a part of a physician visit, or during a hospital or nursing home stay. It is estimated to grow to 4.9 percent by 2028. This results in total spending on prescription drugs as a share of NHE growing from 13.7 percent to 13.8 percent between 2018 and 2028.
Therefore, the CMS report clearly highlights that while all attention is on drugs, they make up for less than 14 percent of the total healthcare spend of US$ 3,649.4 billion. The CMS numbers lead to retail prescription drug spending estimates at US$ 335 billion and non-retail drug spending estimates at US$ 164.7 billion.
List of Top Prescription Drugs Used in U.S. Households (FREE Excel Available)
Central nervous system drugs register maximum patients
According to MEPS, while the highest household spend was on metabolic diseases (almost US$ 100 billion), drugs for the central nervous system had the highest number of patients.


Insulin analogs and sitagliptin were the top four drugs by
household expenditure with a combined spend of over US$ 36 billion. These
anti-diabetes medications have witnessed a compounded increase in prices
(between 10 and 26 percent over the past five years) and prescriptions (ranging
between 4 and 14 percent compounded over the past five years).
Insulin Glargine was the single highest
household expense with a spend of over US$ 14.4 billion.
While commonly used anti-diabetes medication Metformin did not rank high on the top household expenditures, it did take the number four spot in total household purchases with over 83 million total purchases, a 2 percent increase over 2017.
List of Top Prescription Drugs Used in U.S. Households (FREE Excel Available)
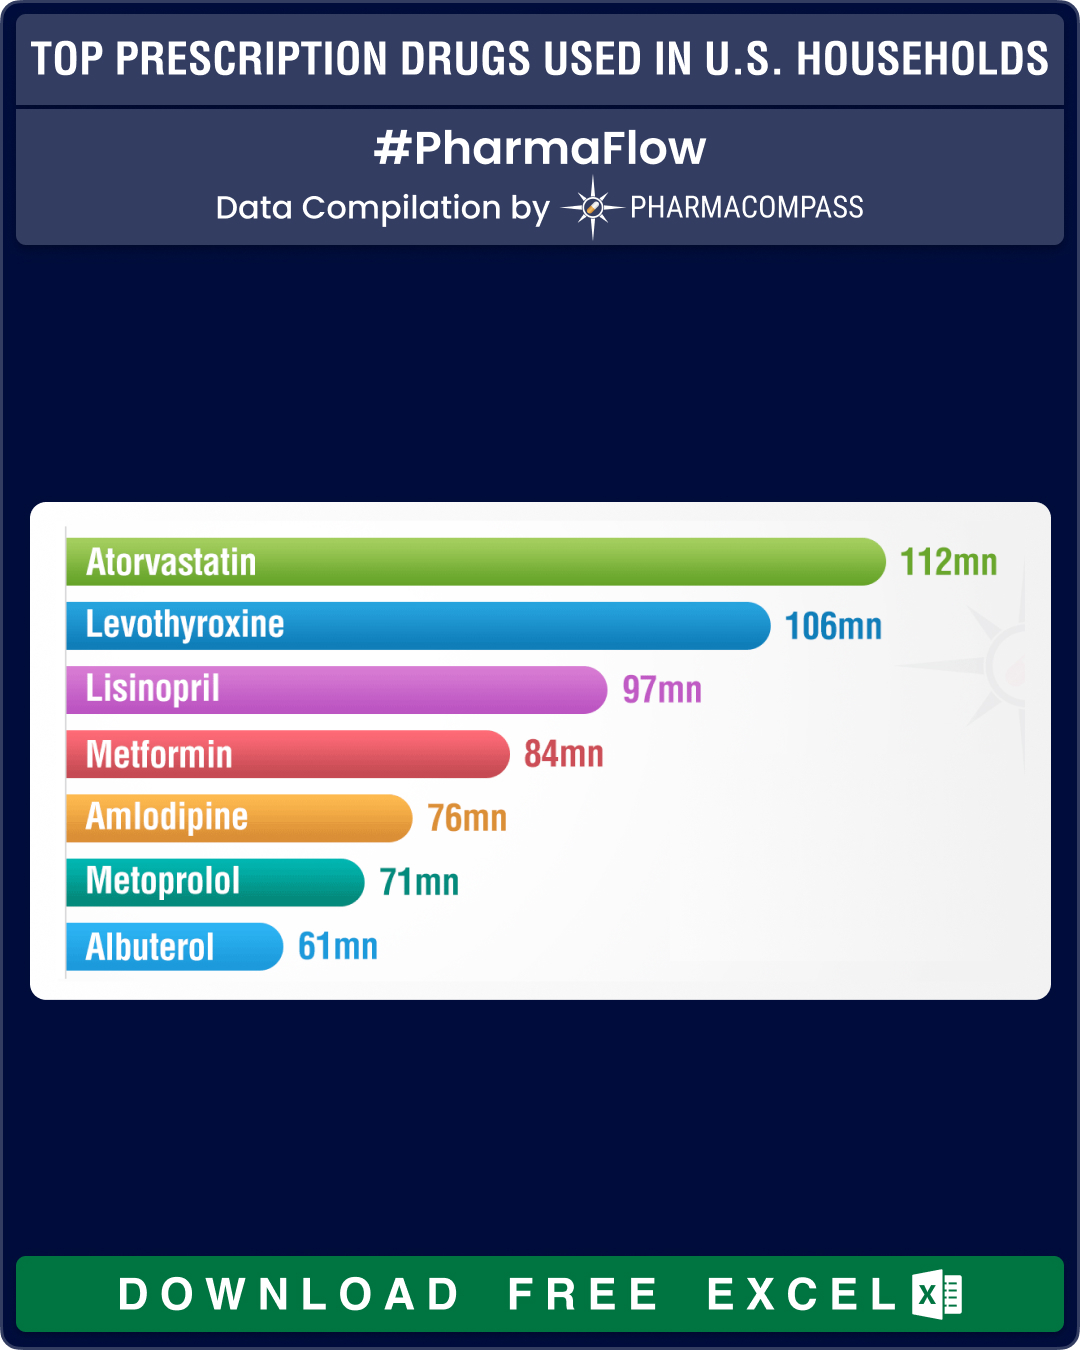
Atorvastatin most purchased drug
The most purchased drug in the United States in 2018 was cholesterol lowering drug atorvastatin with 112 million purchases, an 11 percent increase over the results from the previous survey. Levothyroxine (a drug used to treat thyroid hormone deficiency) took the number two spot (106 million purchases, an increase of 2 percent). Blood pressure medicines — lisinopril and amlodipine — were the others in the top five most commonly purchased drugs.
List of Top Prescription Drugs Used in U.S. Households (FREE Excel Available)
Tamiflu API sees highest growth
Though the survey was conducted in 2018, well before the Covid-19 pandemic struck the world, the active pharmaceutical ingredient (API) of the antiviral Tamiflu (oseltamivir) witnessed the highest compounded growth rate for a single drug — a 32 percent increase in household purchases over five years.
With a compounded price increase of 12 percent over five years, the household expenditure on oseltamivir reached US$ 1.2 billion with over 8.14 million total purchases. Less commonly used products like phentermine, ketoconazole topical and metronidazole also witnessed significant growth over the past five years.
The drugs which witnessed price increases of over 15 percent in the past five years included commonly used pain relievers like acetaminophen and naproxen along with products like amitriptyline, digoxin, prednisolone ophthalmic and hydroxychloroquine.
List of Top Prescription Drugs Used in U.S. Households (FREE Excel Available)
Drugs make up for only 14 percent of total healthcare spend in US
The US pharmaceutical market is the largest pharmaceuticals market in the world and accounted for more than 40 percent global pharmaceuticals sales in 2017.
However, the drug industry has been of the view that the trend in prescription drug costs is not as dire as some argue. According to various reports and surveys, prescription drugs costs in the US — both the prices for drugs and how much money society spends on medicines — have been remarkably stable in recent years, they say.
According to CMS, America’s spending on retail prescription drugs grew just 0.4 percent in 2017. The growth in drug spending was slower than the spending growth for hospital services (4.6 percent), physician services (4.2 percent) and overall health care expenditures (3.8 percent). A report by IQVIA found that the average net price for brand-name drugs grew less than 2 percent in 2017.
Therefore, it’s only after the inauguration of the new President of the US in January 2021 will we have any idea about where the drug prices in the US are headed, the recent executive orders notwithstanding.
List of Top Prescription Drugs Used in U.S. Households (FREE Excel Available)
The PharmaCompass Newsletter – Sign Up, Stay Ahead
Feedback, help us to improve. Click here
Image Credit : Top Prescription Drugs Used in U.S. Households by PharmaCompass is licensed under CC BY 2.0
“ The article is based on the information available in public and which the author believes to be true. The author is not disseminating any information, which the author believes or knows, is confidential or in conflict with the privacy of any person. The views expressed or information supplied through this article is mere opinion and observation of the author. The author does not intend to defame, insult or, cause loss or damage to anyone, in any manner, through this article.”