BLOG
MARKET INTEL by PharmaCompass
CONTENT by Suppliers
- Interview #SpeakPharma
- Video #SupplierSpotlight
- Vlog #PharmaReel
- Company Bio #AboutSupplier
- Services Bio #AboutCapabilities
News
Create content with us, ask us

In 2016, M&A deals
fell drastically in both numbers and value. One key reason was the falling
through of the Pfizer-Allergan mega merger due to America’s crack down on inversion deals.
The year 2015 went down in history as a record year for mergers and acquisitions (M&As) in the pharmaceutical and biotech space, when deals worth US $ 300 billion were announced.
The highlight of 2015 was the mega-merger announced between US drugmaker Pfizer and Ireland-based Allergan – the biggest-ever pharma transaction that was worth more than US$ 160 billion.
2016 saw Pfizer and Allergan walk away from their US$ 160 billion merger when the new US Treasury rules cracked down on inversion deals that were encouraging US companies to move overseas to cut taxes.
The merger would have allowed New York-based Pfizer to cut its tax bill by an estimated US$ 1 billion annually by domiciling in Ireland, where tax rates are lower.
M&A deals dip by 20
percent in 2016
Although the Pfizer-Allergan mega-merger did not go through, The Pharma Letter tracked transactions through the year and noted that although “worldwide merger and acquisition activity in the pharmaceutical and biotechnology sector in 2016 was plentiful”, the numbers and values were “well down” on those seen in the previous two years.
The number of transactions announced in 2016 was 130, compared to 166 M&A deals in 2015 – which was a record year – and 137 in 2014, says The Pharma Letter.
Values of the top 10 deals
drop to a third
The other crucial fact about M&A deals in 2016 was that transactions that exceeded the US$ 1 billion mark were down to just 23 in 2016, as against 30 in 2015 and 26 in 2014.
The Pharma Letter quotes a KPMG report published earlier this year which notes that the total value of the top 10 completed deals in the first half of 2016 amounted to US $ 67.2 billion as opposed to US $190.4 billion in first-half 2015.
Sanofi-Actelion — the deal that wasn’t
Sanofi made headlines, not for the acquisitions it made, but for the ones it wasn’t able to close.
Late last year, the French pharma giant was widely identified as the big player that managed to push Johnson & Johnson away from negotiations with Actelion only to lose its US$ 30 billion bid to J&J even though it would have delivered “approximately equivalent value to Actelion’s shareholders”.
The Actelion loss came after Sanofi was out bid by Pfizer for Medivation.
Pfizer agreed to buy the US cancer drug company for US$ 14 billion in cash, adding its blockbuster prostate cancer drug Xtandi to the company's growing oncology roster.
Additionally, Pfizer acquired Anacor for US$ 5.2 billion to add an eczema gel to its portfolio.
Bayer’s US$ 66 billion takeover
The biggest deal announced in 2016 was Bayer’s US$ 66 billion takeover of the US seeds company Monsanto after months of wrangling. It was the German drug and crop-chemical company’s third offer that clinched the deal, which is also known to be the largest all-cash deal on record.
This signature deal has disrupted the agribusiness sector, which in recent years has been involved in a consolidation race largely triggered by factors such as shifting weather patterns, intense competition in grain exports and a souring global farm economy.
Top pharma companies by sales
Bayer’s acquisition of Monsanto makes the ranking of top pharmaceutical companies consistently complicated since Bayer will generate more sales from its crop science and high-tech polymer division than from the sale of prescription drugs.
Should divisions like diagnostics, animal health, vaccines, consumer health be counted while determining the size of a pharmaceutical company?
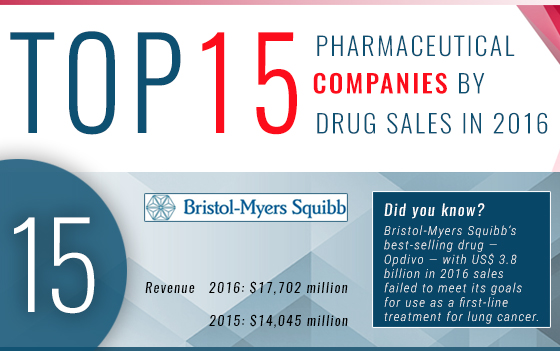
In a volatile global world, where wild exchange rate fluctuations play their own major role in determining the size of organizations, this week PharmaCompass shares the revenues, as presented in the 2016 annual reports of top 15 companies, so that you can draw your own conclusions on the top drug companies of the world.
| Company Name | Currency | Pharma | Consumer Health | Medical Devices/ Diagnostics | Vaccines | Animal Health | Other Revenues | Total Sales | |
|---|---|---|---|---|---|---|---|---|---|
| 1 | Pfizer | USD | 41,600 | 3,407 | 6,071 | 1,746 | 52,824 | ||
| 2 | Novartis | USD | 48,518 | 48,518 | |||||
| 3 | Roche | CHF | 41,047 | 11,589 | 52,636 | ||||
| 4 | Merck & Co. | USD | 29,360 | 5,791 | 3,478 | 1,178 | 39,807 | ||
| 5 | GlaxoSmithKline | GBP | 16,104 | 7,193 | 4,592 | 27,889 | |||
| 6 | Johnson & Johnson | USD | 33,464 | 13,307 | 25,119 | 71,890 | |||
| 7 | Sanofi | EUR | 22,932 | 3,330 | 4,577 | 2,708 | 274 | 33,821 | |
| 8 | Gilead | USD | 29,953 | 437 | 30,390 | ||||
| 9 | Abbvie | USD | 25,560 | 78 | 25,638 | ||||
| 10 | Bayer | EUR | 16,420 | 6,037 | 1,523 | 22,789 | 46,769 | ||
| 11 | Amgen | USD | 21,892 | 1,099 | 22,991 | ||||
| 12 | Astrazeneca | USD | 21,319 | 1,683 | 23,002 | ||||
| 13 | Teva | USD | 20,664 | 1,239 | 21,903 | ||||
| 14 | Eli Lilly | USD | 18,064 | 3,158 | 21,222 | ||||
| 15 | Bristol-Myers Squibb | USD | 17,702 | 1,725 | 19,427 |
Sales figures are reported in millions.
Currency exchange rate used CHF: 0.99 USD/ EUR: 1.06 USD / GBP: 1.25 USD
Ranking methodology
When it came to ranking companies, based on their total sales, we at PharmaCompass did not face any challenges while including the sales of prescription drugs along with those of vaccines.
But matters got a little complicated when we got down to ranking consumer health divisions.
For instance, while we have included consumer health divisions of companies like Sanofi, GSK and Bayer, which primarily sell OTC drug products (such as brands like Allegra, Voltaren and Aleve), we have excluded those of companies like Johnson & Johnson, given their focus on baby and beauty products.
Such a demarcation — based on the focus of the company — will always be a matter of debate.
Similarly, revenue generated from the sale of medical devices/diagnostics as well as revenues of animal health divisions were not included in our rankings.
In the case of companies like Bayer, whose Covestro’s division has over US$ 10 billion in sales from customer industries such as automotive, construction, electrical and electronics, and furniture, such sales were accounted for in ‘other revenues’.
Our table highlights the sales revenue of various divisions of companies in order to bring more clarity into the figures which were included in our rankings.
The PharmaCompass Newsletter – Sign Up, Stay Ahead
Feedback, help us to improve. Click here
“ The article is based on the information available in public and which the author believes to be true. The author is not disseminating any information, which the author believes or knows, is confidential or in conflict with the privacy of any person. The views expressed or information supplied through this article is mere opinion and observation of the author. The author does not intend to defame, insult or, cause loss or damage to anyone, in any manner, through this article.”