


Acquisitions and spin-offs dominated headlines in 2019 and the tone was set very early with Bristol-Myers Squibb acquiring
New Jersey-based cancer drug company Celgene in a US$ 74 billion deal announced on
January 3, 2019. After factoring
in debt, the deal value ballooned to about US$ 95 billion, which according
to data compiled by Refinitiv, made it the largest healthcare deal on
record.
In the summer, AbbVie Inc,
which sells the world’s best-selling drug Humira, announced its acquisition of Allergan Plc, known for Botox and other cosmetic
treatments, for US$ 63 billion. While the companies are still awaiting
regulatory approval for their deal, with US$ 49 billion in combined 2019
revenues, the merged entity would rank amongst the biggest in the industry.
View Our Interactive Dashboard on Top drugs by sales in 2019 (Free Excel Available)
The big five by pharmaceutical sales — Pfizer,
Roche, J&J, Novartis and Merck
Pfizer
continued
to lead companies by pharmaceutical sales by reporting annual 2019 revenues of
US$ 51.8 billion, a decrease of US$ 1.9 billion, or 4 percent, compared to
2018. The decline was primarily attributed to the loss of exclusivity of Lyrica in 2019,
which witnessed its sales drop from US$ 5 billion in 2018 to US$ 3.3 billion in
2019.
In 2018, Pfizer’s then incoming CEO Albert Bourla had mentioned that the company did not see the need for any large-scale M&A activity as Pfizer had “the best pipeline” in its history, which needed the company to focus on deploying its capital to keep its pipeline flowing and execute on its drug launches.
Bourla stayed true to his word and barring the acquisition of Array Biopharma for US$ 11.4 billion and a spin-off to merge Upjohn, Pfizer’s off-patent branded and generic established medicines business with
Mylan, there weren’t any other big ticket deals which were announced.
The
Upjohn-Mylan merged entity will be called Viatris and is expected to have 2020
revenues between US$ 19 and US$ 20 billion
and could outpace Teva to
become the largest generic company in the world, in term of revenues.
Novartis, which had
followed Pfizer with the second largest revenues in the pharmaceutical industry
in 2018, reported its first full year earnings after spinning off its Alcon eye
care devices business division that
had US$ 7.15 billion in 2018 sales.
In 2019,
Novartis slipped two spots in the ranking after reporting total sales of US$
47.4 billion and its CEO Vas Narasimhan continued his deal-making spree by buying New
Jersey-headquartered The Medicines Company (MedCo) for US$ 9.7
billion to acquire a late-stage cholesterol-lowering
therapy named inclisiran.
As Takeda Pharmaceutical Co was
busy in 2019 on working to reduce its debt burden incurred due to its US$ 62
billion purchase of Shire Plc, which was announced in 2018, Novartis also purchased
the eye-disease medicine, Xiidra, from the Japanese drugmaker for US$ 5.3 billion.
Novartis’ management also spent a considerable part of 2019 dealing with data-integrity concerns which emerged from its 2018 buyout of AveXis, the
gene-therapy maker Novartis had acquired for US$ 8.7 billion.
The deal gave Novartis rights to Zolgensma,
a novel treatment intended for children less than two years of age with the
most severe form of spinal muscular atrophy (SMA). Priced at US$ 2.1 million,
Zolgensma is currently the world’s most expensive drug.
However,
in a shocking announcement, a month after approving the drug, the US Food and
Drug Administration (FDA) issued a press release on
data accuracy issues as the agency was informed by AveXis that
its personnel had manipulated data which
the FDA used to evaluate product comparability and nonclinical (animal)
pharmacology as part of the biologics license application (BLA), which was
submitted and reviewed by the FDA.
With US$
50.0 billion (CHF 48.5 billion) in annual pharmaceutical sales, Swiss drugmaker
Roche came in at number two position in 2019
as its sales grew 11 percent driven by
its multiple sclerosis medicine Ocrevus, haemophilia drug Hemlibra and cancer medicines Tecentriq and Perjeta.
Roche’s newly introduced medicines generated US$ 5.53 billion (CHF 5.4 billion) in growth, helping offset the impact of the competition from biosimilars for its three best-selling drugs MabThera/Rituxan, Herceptin and Avastin.
In late 2019, after months of increased
antitrust scrutiny, Roche completed
its US$ 5.1 billion acquisition of Spark Therapeutics to strengthen its presence in
gene therapy.
Last year, J&J reported almost flat worldwide sales of US$ 82.1 billion. J&J’s pharmaceutical division generated US$ 42.20 billion and its medical devices and consumer health divisions brought in US$ 25.96 billion and US$ 13.89 billion respectively.
Since J&J’s consumer health division sells analgesics, digestive health along with beauty and oral care products, the US$ 5.43 billion in consumer health sales from over-the-counter drugs and women’s health products was only used in our assessment of J&J’s total pharmaceutical revenues. With combined pharmaceutical sales of US$ 47.63 billion, J&J made it to number three on our list.
While the sales of products like Stelara, Darzalex, Imbruvica, Invega Sustenna drove J&J’s pharmaceutical business to grow by 4 percent over 2018, the firm had to contend with generic competition against key revenue contributors Remicade and Zytiga.
US-headquartered Merck, which is known as
MSD (short for Merck Sharp & Dohme) outside the United States and
Canada, is set to significantly move up the rankings next year fueled by its
cancer drug Keytruda, which witnessed a 55
percent increase in sales to US$ 11.1 billion.
Merck reported total revenues of US$ 41.75 billion and also
announced it will spin off its women’s health drugs,
biosimilar drugs and older products to create a new pharmaceutical
company with US$ 6.5 billion in annual revenues.
The firm had anticipated 2020 sales between US$ 48.8 billion and US$ 50.3 billion however this week it announced that the coronavirus pandemic will reduce 2020 sales by more than $2 billion.
View Our Interactive Dashboard on Top drugs by sales in 2019 (Free Excel Available)
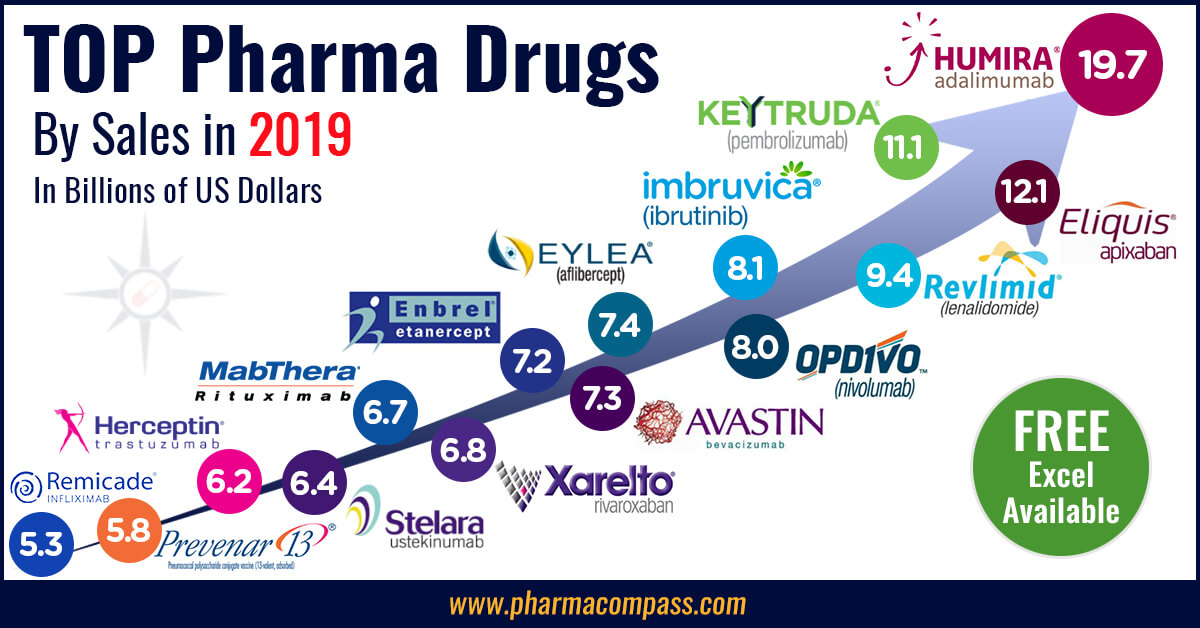
Humira holds on to remain world’s best-selling drug
AbbVie’s acquisition of Allergan comes as the firm faces the expiration of patent protection for Humira, which brought in a staggering US$ 19.2 billion in sales last year for
the company. AbbVie has failed to successfully acquire or develop a major new
product to replace the sales generated by its flagship drug.
In 2019, Humira’s US revenues increased 8.6 percent to US$ 14.86 billion while internationally, due
to biosimilar competition, the sales dropped 31.1 percent to US$ 4.30 billion.
Bristol Myers Squibb’s Eliquis, which is also marketed by Pfizer, maintained its number two position
and posted total sales of US$ 12.1 billion, a 23 percent increase over 2018.
While Bristol Myers Squibb’s immunotherapy treatment Opdivo, sold in partnership with Ono in Japan, saw sales increase from US$ 7.57 billion to US$ 8.0 billion, the growth paled in comparison to the US$ 3.9
billion revenue increase of Opdivo’s key immunotherapy competitor Merck’s Keytruda.
Keytruda took the number three spot in drug sales that
previously belonged to Celgene’s Revlimid, which witnessed a sales decline from US$ 9.69 billion to US$ 9.4 billion.
Cancer treatment Imbruvica, which is marketed
by J&J and AbbVie, witnessed a 30 percent increase in sales. With US$ 8.1
billion in 2019 revenues, it took the number five position.
View Our Interactive Dashboard on Top drugs by sales in 2019 (Free Excel Available)
Vaccines – Covid-19 turns competitors into partners
This year has been dominated by the single biggest health emergency in years — the novel coronavirus (Covid-19) pandemic. As drugs continue to fail to meet expectations, vaccine development has received a lot of attention.
GSK reported the highest vaccine sales of all drugmakers with
total sales of US$ 8.4 billion (GBP 7.16 billion), a significant portion of its
total sales of US$ 41.8 billion (GBP 33.754 billion).
US-based Merck’s vaccine division also reported a significant increase in sales to US$ 8.0 billion and in 2019 received FDA and EU approval to market its Ebola vaccine Ervebo.
This is the first FDA-authorized vaccine against the deadly virus which causes
hemorrhagic fever and spreads from person to person through direct contact with
body fluids.
Pfizer and Sanofi also reported an increase in their vaccine sales to US$ 6.4
billion and US$ 6.2 billion respectively and the Covid-19 pandemic has recently
pushed drugmakers to move faster than ever before and has also converted
competitors into partners.
In a rare move, drug behemoths — Sanofi and GlaxoSmithKline (GSK) —joined hands to develop a vaccine for the novel coronavirus.
The two companies plan to start human trials
in the second half of this year, and if things go right, they will file
for potential approvals by the second half of 2021.
View Our Interactive Dashboard on Top drugs by sales in 2019 (Free Excel Available)
Our view
Covid-19 has brought the world economy to a grinding halt and shifted the global attention to the pharmaceutical industry’s capability to deliver solutions to address this pandemic.
Our compilation shows that vaccines and drugs
for infectious diseases currently form a tiny fraction of the total sales of
pharmaceutical companies and few drugs against infectious diseases rank high on
the sales list.
This could well explain the limited range of
options currently available to fight Covid-19. With the pandemic currently infecting
over 3 million people spread across more than 200 countries, we can safely
conclude that the scenario in 2020 will change substantially. And so should our
compilation of top drugs for the year.
View Our Interactive Dashboard on Top drugs by sales in 2019 (Free Excel Available)
Impressions: 54752
https://www.pharmacompass.com/radio-compass-blog/top-drugs-and-pharmaceutical-companies-of-2019-by-revenues
#PharmaFlow by PHARMACOMPASS
29 Apr 2020
This week, PharmaCompass
reviews the recently released data on prescription drugs paid for under the
Medicare Part D Prescription Drug Program in the United States in calendar year
2016.
But first, let’s understand what is Medicare.
Medicare is the federal health insurance program in the US. In 2017, it covered 58.4 million people — 49.5 million aged 65 and older, and 8.9 million disabled.
Prescription drug coverage under this
program was started in 2006, and is known as Medicare Part D.
As part of this
coverage, the Centers for Medicare & Medicaid Services (CMS) contracts insurance
companies and other private companies, known as plan sponsors, that offer
prescription drug plans to their beneficiaries with varying drug coverage and
cost-sharing requirements.
In
2017, the Congressional Budget Office (CBO) had estimated that spending on
Medicare Part D would reach US$ 94 billion, or about 16 percent of all Medicare
expenditures for the year.
Click here to access the compilation of Medicare Part D
Prescriber Summary Report
According
to the CBO, Medicare Part D is the most significant expansion of the Medicare
program since it was created by Congress in 1965.
With
more than 1.48 billion claims from beneficiaries enrolled under the Part D
prescription drug benefit program under its umbrella, our analysis of Medicare
Part D provides valuable insights into how elderly Americans use prescription
drugs.
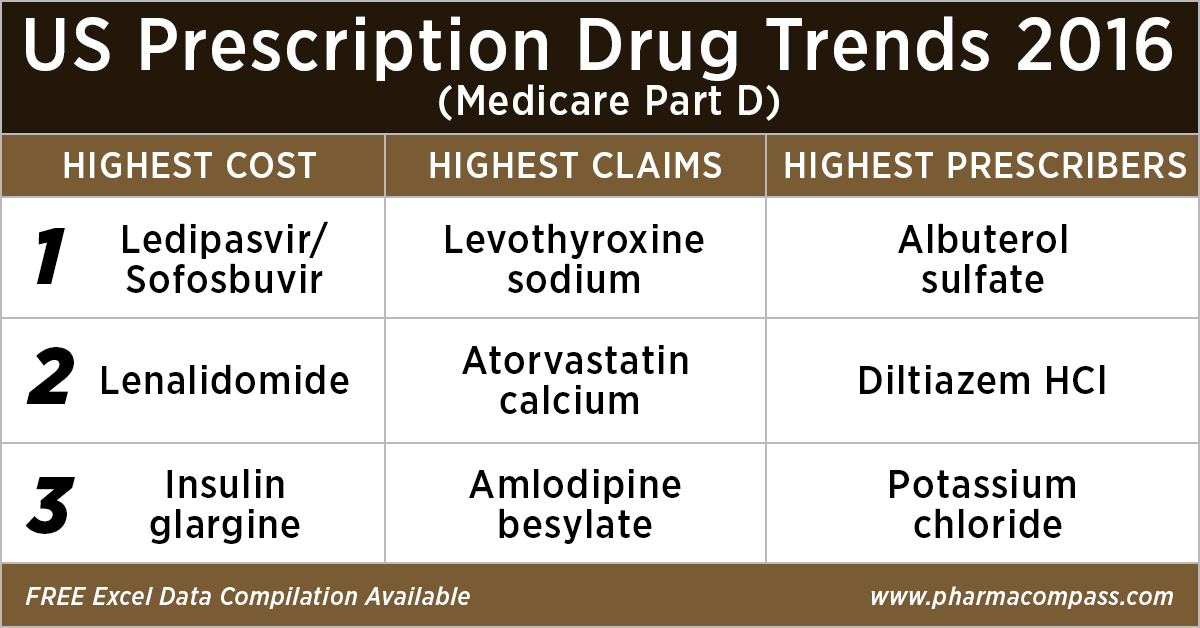
Top 10 drugs by
cost: The ones that bore the highest cost burden for Medicare
As in 2015, in 2016
too Gilead’s Hepatitis C treatment — Ledipasvir/Sofosbuvir (Harvoni) — remained the single drug highest payout under the Medicare Part D Prescription Drug Program with a total cost of US$ 4.4 billion.
As Gilead continued
to face competition from AbbVie and Merck in the Hepatitis C space, the spending on Harvoni was down
37 percent from US$ 7.03 billion in 2015.
Click here to access the compilation of Medicare Part D
Prescriber Summary Report
Celgene’s cancer treatment, Lenalidomide (Revlimid), Sanofi and Merck’s diabetes treatments and AstraZeneca’s Crestor (Rosuvastatin Calcium) for
cholesterol followed Harvoni. All together, they cost the Medicare program over US$ 10 billion.
Generic Name
Number of Medicare Part D Claims
Number of Medicare Beneficiaries
Number of Prescribers
Aggregate Cost Paid for Part D
Claims (In USD)
LEDIPASVIR/ SOFOSBUVIR (HARVONI)
141,665
52,782
12,097
4,398,534,465
LENALIDOMIDE
239,049
35,368
10,382
2,661,106,127
LANTUS SOLOSTAR (INSULIN
GLARGINE, HUM.REC.ANLOG )
5,028,485
1,075,248
245,447
2,526,048,766
SITAGLIPTIN PHOSPHATE
4,742,505
864,442
206,223
2,440,013,513
ROSUVASTATIN CALCIUM
6,012,444
1,560,050
249,981
2,322,724,007
FLUTICASONE/SALMETEROL
5,194,391
1,196,007
275,442
2,319,808,482
PREGABALIN
4,940,115
852,497
267,532
2,098,953,250
RIVAROXABAN
4,403,332
807,820
252,141
1,954,748,890
APIXABAN
4,455,782
826,969
231,631
1,926,107,484
TIOTROPIUM BROMIDE
4,153,162
903,494
235,564
1,818,857,361
Click here to access the compilation of Medicare Part D
Prescriber Summary Report
Top 10 drugs by claims: The most commonly
used drugs of 2016
With 46.6 million claims, the thyroid hormone deficiency treatment — Levothyroxine Sodium — retained its position of being the most claimed product under Medicare’s Part D Prescription Drug Program in 2016.
The number of
Medicare Part D claims includes original prescriptions and refills.
Following Levothyroxine Sodium was the lipid-lowering agent — Atorvastatin Calcium — which had 44.5 million Medicare Part D claims that
were filed by almost 9.4 million beneficiaries.
Generic
Name
Number
of Prescribers
Number
of Medicare Part D Claims
Number
of Medicare Beneficiaries
LEVOTHYROXINE SODIUM
669,999
46,617,109
8,091,785
ATORVASTATIN CALCIUM
494,973
44,595,686
9,435,633
AMLODIPINE BESYLATE
497,017
39,913,468
7,802,905
LISINOPRIL
490,452
39,469,840
8,009,954
OMEPRAZOLE
492,951
32,909,236
7,001,160
METFORMIN HCL
611,700
31,007,932
6,394,014
SIMVASTATIN
380,560
29,687,947
6,201,911
HYDROCODONE/ACETAMINOPHEN
660,617
28,595,150
7,265,882
FUROSEMIDE
488,352
27,878,243
5,421,598
GABAPENTIN
555,997
27,627,466
5,363,382
Click here
to access the compilation of Medicare Part D Prescriber Summary Report
Top 10 drugs by prescribers: Medicines that were most popular with
doctors
Among the prescribers, albuterol sulfate (salbutamol) and Diltiazem had
over 900,000 unique providers (or
doctors) prescribing the drug.
Albuterol (salbutamol) is
used to provide quick relief from wheezing and shortness
of breath while Diltiazem is used to prevent chest
pain (angina).
Also
on the list of popular drugs with prescribers is Hydrocodone-Acetaminophen.
With more doctors prescribing Hydrocodone-Acetaminophen (an
opioid) than commonly used antibiotics, such as Cephalexin, Ciprofloxacin and Amoxicillin, the
series of new FDA initiatives to combat the epidemic of opioid misuse and abuse
should change the position of opioids in the top 10 drugs by prescribers in the
coming years.
Click here to access the compilation of Medicare Part D
Prescriber Summary Report
Generic
Name
Number of
Prescribers
Number of
Medicare Part D Claims
Number of
Medicare Beneficiaries
ALBUTEROL SULFATE
985,427
13,100,354
5,417,718
DILTIAZEM HCL
931,159
8,142,004
1,982,550
POTASSIUM CHLORIDE
879,491
18,945,969
4,278,000
PEN NEEDLE, DIABETIC
677,210
5,281,778
1,795,046
LEVOTHYROXINE SODIUM
669,999
46,617,109
8,091,785
HYDROCODONE/ACETAMINOPHEN
660,617
28,595,150
7,265,882
METFORMIN HCL
611,700
31,007,932
6,394,014
CEPHALEXIN
597,647
5,603,879
3,933,373
CIPROFLOXACIN HCL
594,129
7,000,081
4,851,657
AZITHROMYCIN
591,028
7,958,625
5,734,122
What does the
future hold?
Although the Part D Prescriber PUF (public use file) has a wealth of information on payment and utilization for Medicare Part D prescriptions, the dataset has a number of limitations. Of particular importance is the fact that the data may not be representative of a physician’s entire practice or all of Medicare as it only includes information on beneficiaries enrolled in the Medicare Part D prescription drug program (i.e., approximately two-thirds of all Medicare beneficiaries).
Click here to access the compilation of Medicare Part D
Prescriber Summary Report
Last
month, the Office of the Inspector General (OIG)
reviewed
the Part D claims data for the years 2011 to 2015 for brand-name drugs.
The OIG’s report found that the total reimbursement for all brand-name drugs in Part D increased 77 percent from 2011 to 2015, despite a 17-percent decrease in the number of prescriptions for these drugs.
With soaring drug prices being an issue for
regular debate in the Unites States and President Trump announcing that his
team will use strategies to strengthen the negotiating powers under
Medicare Part D and Part B, it remains to be seen how the data on prescription drugs paid for under
the Medicare Part D Prescription Drug Program will change in the coming years.
Click here to access the compilation of Medicare Part D
Prescriber Summary Report
Impressions: 2500
https://www.pharmacompass.com/radio-compass-blog/analyzing-over-us-90-billion-of-medicare-prescription-drug-part-d-spending-in-2016
#PharmaFlow by PHARMACOMPASS
05 Jul 2018
In less than three weeks, Donald Trump will assume office as the
President of the United States. He has mentioned that he wants Medicare (a
national social insurance program) to directly negotiate the price it pays for prescription drugs.
Medicare provides health insurance to Americans aged 65 or more, who
have worked and paid into the system through the payroll tax. It also provides
health insurance to younger people with some disabilities or end-stage renal
disease and amyotrophic lateral sclerosis.
In 2015, Medicare provided health insurance to over 55 million Americans — including 46 million people aged 65 or more, and nine million younger people.
As we flag off the New Year, PharmaCompass
provides insights into drug prices and prescription patterns in the US in order
to help professionals make informed decisions. We believe that the cost of
medicines in the US, which have been a subject of much public outcry and
discussions in the recent years, will continue to be scrutinized during 2017.
Medicare data for 2014
Medicare Part D, also known as the Medicare prescription drug benefit — the program which subsidizes the costs of prescription drugs and prescription drug insurance premiums for Medicare beneficiaries — published a data set (for calendar year 2014) which contains information from over one million healthcare providers
who collectively prescribed approximately US $121 billion worth of prescription
drugs paid for under this program.
For each prescriber and drug, the dataset
includes the total number of prescriptions that were dispensed (including
original prescriptions and any refills), and the total drug cost.
The total drug cost includes the ingredient cost of the medication, dispensing fees, sales tax, and any applicable administration fees. It’s based on the amounts paid by the Part D plan, the Medicare beneficiary, other government subsidies, and any other third-party payers (such as employers and liability insurers).
The total drug cost does not reflect any manufacturer rebates paid to Part D plan sponsors through direct and indirect remuneration or point-of sale rebates. In order to protect the beneficiary’s privacy, the Centers for Medicare & Medicaid Services (CMS) did not
include information in cases where 10 or fewer prescriptions were dispensed.
Top
Ten Drugs by Cost, 2014 [Most expensive for Medicare]
Drug Name
Total Claim Count
Beneficiary Count
Prescriber Count
Total Drug Cost
Sofosbuvir
109,543
33,028
7,323
$3,106,589,192
Esomeprazole Magnesium
7,537,736
1,405,570
286,927
$2,660,052,054
Rosuvastatin Calcium
9,072,799
1,752,423
266,499
$2,543,475,142
Aripiprazole
2,963,457
405,048
130,933
$2,526,731,476
Fluticasone/Salmeterol
6,093,354
1,420,515
281,775
$2,276,060,161
Tiotropium Bromide
5,852,258
1,211,919
253,277
$2,158,219,163
Lantus
Solostar
(Insulin Glargine)
4,441,782
972,882
224,710
$2,016,728,436
Sitagliptin Phosphate
4,495,964
789,828
190,741
$1,775,094,282
Lantus
(Insulin Glargine)
4,284,173
787,077
223,502
$1,725,391,907
Lenalidomide
178,373
27,142
9,337
$1,671,610,362
View the Medicare Part D National Prescriber Summary Report, Calendar Year 2014 (Excel version available) for FREE!
Top
Ten Drugs by Average Cost per Claim, 2014 [Most expensive drugs]
Drug Name
Total Claim Count
Beneficiary Count
Prescriber Count
Total Drug Cost
Average Cost Per Claim
Adagen
13
$1,224,835
$94,218
Elaprase
100
$6,560,225
$65,602
Cinryze
1,820
194
196
$96,155,785
$52,833
Carbaglu
60
$2,901,115
$48,352
Naglazyme
129
$6,189,045
$47,977
Berinert
538
73
68
$25,685,311
$47,742
Firazyr
1,568
269
232
$70,948,143
$45,248
H.P. Acthar
9,611
2,932
1,621
$391,189,653
$40,702
Procysbi
314
41
47
$12,542,911
$39,946
Folotyn
15
$598,210
$39,881
Top
Ten Drugs by Claims, 2014 [Most Commonly Used by Patients]
Generic Name
Total Claim Count
Beneficiary Count
Prescriber Count
Total Drug Cost
Lisinopril
38,278,860
7,454,940
464,747
$281,614,340
Levothyroxine Sodium
37,711,869
6,245,507
416,518
$631,855,415
Amlodipine Besylate
36,344,166
6,750,062
451,350
$303,779,661
Simvastatin
34,092,548
6,768,159
387,651
$346,677,118
Hydrocodone-Acetaminophen
33,446,696
8,005,790
677,865
$676,296,988
Omeprazole
33,032,770
6,707,964
475,122
$529,050,385
Atorvastatin Calcium
32,603,055
6,740,061
419,327
$747,635,818
Furosemide
27,133,430
5,176,582
456,047
$135,710,772
Metformin HCl
23,475,787
4,509,978
364,273
$203,948,989
Gabapentin
22,143,641
4,298,609
486,754
$492,557,255
View the Medicare Part D National Prescriber Summary Report, Calendar Year 2014 (Excel version available) for FREE!
Top
Ten Drugs by Prescribers, 2014 [Most Popular with Doctors]
Generic Name
Total Claim Count
Beneficiary Count
Prescriber Count
Total Drug Cost
Hydrocodone/Acetaminophen
33,446,696
8,005,790
677,865
$676,296,988
Ciprofloxacin HCl
7,253,018
4,926,835
568,201
$46,728,353
Amoxicillin
6,298,980
4,384,899
557,614
$31,193,739
Cephalexin
5,040,219
3,529,303
557,048
$36,987,401
Azithromycin
7,339,954
5,274,010
544,625
$70,699,119
Prednisone
11,032,986
4,505,821
536,108
$86,537,932
Tramadol HCl
14,250,227
4,272,724
515,816
$125,343,514
Sulfamethoxazole /Trimethoprim
4,833,758
3,090,944
500,790
$29,231,511
Gabapentin
22,143,641
4,298,609
486,754
$492,557,255
Amoxicillin/Potassium Clav
3,551,452
2,710,244
478,361
$61,713,432
The findings from CMS
data
The CY 2014 data represented a 17 percent
increase compared to the 2013 data set and a substantial part of the total estimated prescription drug spending (as estimated by the Department of Health and Human Services Office of the Assistant Secretary for Planning and Evaluation, or ASPE) in the United States — at about US $ 457 billion in 2015, which was 16.7 percent of the overall personal healthcare services.
Of that US $ 457 billion, US $ 328 billion (71.9 percent) was for retail
drugs and US $ 128 billion (28.1 percent) was for non-retail drugs.
The drug pricing process in the US is complex and
reflects the influence of numerous factors, including manufacturer list prices,
confidential negotiated discounts and rebates, insurance plan benefit designs,
and patient choices.
An IMS study found that across 12 therapy classes widely used in Medicare Part D,
medicine costs to plans and patients in Medicare Part D are 35 percent below
list prices.
View the Medicare Part D National Prescriber Summary Report, Calendar Year 2014 (Excel version available) for FREE!
While the CMS does not
currently have an established formulary, Part D drug coverage excludes drugs
not approved by the US Food and Drug Administration, those prescribed for off-label
use, drugs not available by prescription for
purchase in the US, and drugs for which payments would be available under Parts
A or B of Medicare.
Part D coverage
excludes drugs or classes of drugs excluded from Medicaid coverage,
such as:
Drugs used for anorexia, weight loss, or weight gain
Drugs used to promote fertility
Drugs used for erectile dysfunction
Drugs used for cosmetic purposes (hair growth, etc.)
Drugs used for the symptomatic relief of cough and colds
Prescription vitamins and mineral products, except prenatal vitamins and fluoride preparations
Drugs where the manufacturer requires (as a condition of sale) any associated tests or monitoring services to be purchased exclusively from that manufacturer or its designee
Our view
The Medicare program is designed such that the
federal government is not permitted to negotiate prices of drugs with the drug
companies, as federal agencies do under other programs.
For instance, the Department of Veterans Affairs — which is allowed to negotiate drug prices and establish a formulary — has been estimated to pay (on an average) between 40 to 58 percent less for drugs, as opposed to Medicare Part D.
If Trump administration kick starts direct
negotiations on Medicare drug prices with drug companies, 2017 will surely turn
out to be a year for the pharmaceutical industry to remember.
View the Medicare Part D National Prescriber Summary Report, Calendar Year 2014 (Excel version available) for FREE!
Impressions: 7923
https://www.pharmacompass.com/radio-compass-blog/drug-costs-and-prescription-trends-in-the-united-states-analyzing-medicare-s-121-billion-spend
#PharmaFlow by PHARMACOMPASS
05 Jan 2017

Unrelated to the inspection of
the USFDA at the Dr. Reddys Srikakulam facility, Dr. Reddys sought permission from the Ministry of Environment,
Forests & Climate Change to expand
their drug and intermediate manufacturing at three locations.
All three chemical technical operation (CTO) units, CTO-I, CTO-II & CTO-III are located in Medak district and the announced planned capacity increases along with the anticipated capital investment were
Existing Capacity
Planned Capacity
Anticipated Investment
CTO I
14.7 TPM
45.5 TPM
Rs 30 crores
CTO II
21.9 TPM
68.9 TPM
Rs 45 crores
CTO - III
4.45 TPM
28.1 TPM
Rs 12 crores
*$1 million is approximately about Rs 6.2
crores & TPM is tons per month
In addition, the declaration given by Dr. Reddys also mentions the various products which will be produced at each facility (table below).
Needless to say, the plans are ambitious however with the growth witnessed by the Indian pharmaceutical industry over the past decade, one can understand Dr. Reddys commitment to investing further in their business.
Table Dr. Reddys production plans at various facilities
Product
Name
Planned
Capacity (TPM)
Facility
Location
Alendronate
Sodium Trihydrate
6.67
CTO
- III
Alfuzosin
2.33
CTO
- I
Altretamine
0.03
CTO
- I
Amlodipine
Besylate
33.33
CTO
- II
Amlodipine
Besylate
133.33
CTO
- III
Amlodipine
Besylate ( Ethyl 4 [2- (pthalamide)ethoxy] aceto acetate (TDM-2)
100
CTO
- II
Amlodipine
Maleate
30
CTO
- III
Amsacrine
0.07
CTO
- I
Anastrazole
0.83
CTO
- II
Aprepitant
3.33
CTO
- III
Aripiprazole
0.33
CTO
- II
Atomoxetine
1.67
CTO
- III
Atorvastatin
375.83
CTO
- II
Azacitidine
0.67
CTO
- I
Bicalutamide
0.03
CTO
- II
Bivalirudin
0.03
CTO
- II
Bivalirudin
Trifluoro Acetate
0.03
CTO
- I
Bortezomib
0.03
CTO
- I
Cabazitaxel
0.02
CTO
- I
Candesartan
cilexetil
6.67
CTO
- II
Cetirizine
Hydrochloride
66.67
CTO
- I
Cetirizine
16.67
CTO
- II
Ciprofloxacin
176.67
CTO
- II
Ciprofloxacin
HCl
533.33
CTO
- II
Ciprofloxacin Lactate
33.33
CTO
- II
Clopidogrel
Bisulfate
500
CTO
- I
Clopidogrel Premix
166.67
CTO
- II
Diluted
Everolimus 5% (Everolimus)
0.33
CTO
- II
Disodium
Pamidronate
0.33
CTO
- III
Docetaxel
1.9
CTO
- I
Dutasteride
3.33
CTO
- II
Esomeprazole
magnesium
66.67
CTO
- III
Ezetimibe
3.33
CTO
- II
Fexofenadine
Hydrochloride
500
CTO
- I
Finasteride
10
CTO
- II
Fluoxetine
110
CTO
- I
Fondaparinux
Sodium
0.33
CTO
- II
Galantamine
0.03
CTO
- II
Gemcitabine
13.33
CTO
- I
Glimepiride
13.33
CTO
- II
Imatinib
0.17
CTO
- I
Irinotecan
0.33
CTO
- I
Ketorolac
66.67
CTO
- II
Lacidipine
5
CTO
- III
Lamotrigine
33.33
CTO
- I
Lansoprozole
8.33
CTO
- III
Letrozole
0.03
CTO
- II
Levocetrizine
Di HCl
10
CTO
- III
Levofloxacin
200
CTO
- II
Lomustine
1.33
CTO
- I
Losartan
Postassium
150
CTO
- I
Meloxicam
0.03
CTO
- I
Memantine
HCl
3.33
CTO
- II
Mesalamine
0.03
CTO
- II
Metoprolol
Succinate
266.67
CTO
- II
Moxifloxacin
116.67
CTO
- II
Norfloxacin
0.03
CTO
- I
Omeprazole
133.33
CTO
- III
Omeprazole
Magnesium
50
CTO
- III
Omeprazole
Sodium
10
CTO
- III
Omerprazole Form B
33.33
CTO
- III
Paclitaxel
0.33
CTO
- I
Pantoprazole
Sodium
100
CTO
- III
paroxetine
HCl
0.03
CTO
- II
Pemetrexed
0.67
CTO
- I
Rabeprazole
Sodium
83.33
CTO
- III
Raloxifene
33.33
CTO
- II
Ramipril
100
CTO
- III
Repaglinide
6.67
CTO
- II
Rivastigmine
6.67
CTO
- II
Risperidone
13.33
CTO
- I
Rivastigmine
6.667
CTO
- I
Rizatriptan
Benzoate
1.33
CTO
- II
Rocuronium
Bromide
0.03
CTO
- II
Ropinrole
HCl
1.83
CTO
- III
Rosiglitazone
3.33
CTO
- II
Sparfloxacin
3.33
CTO
- I
Tacrolimus
5
CTO
- II
Tadalafil
3.33
CTO
- II
Telmisartan
100
CTO
- II
Temozolamide
0.03
CTO
- I
Terbinafine
HCl
133.33
CTO
- III
Tizanidine
HCl
16.67
CTO
- III
Topotecan
0.07
CTO
- I
valganciclovir
0.03
CTO
- I
Vardenafil
3.33
CTO
- II
Voriconazole
8.33
CTO
- III
Ziprasidone
Hydrochloride
100
CTO
- I
Zoledronic
acid
0.33
CTO
- III
Zolmitriptan
0.83
CTO
- I
Zonisamide
0.03
CTO
- II
Impressions: 3086
https://www.pharmacompass.com/radio-compass-blog/dr-reddy-s-expansion-plans-for-api-production
#PharmaFlow by PHARMACOMPASS
03 Apr 2015