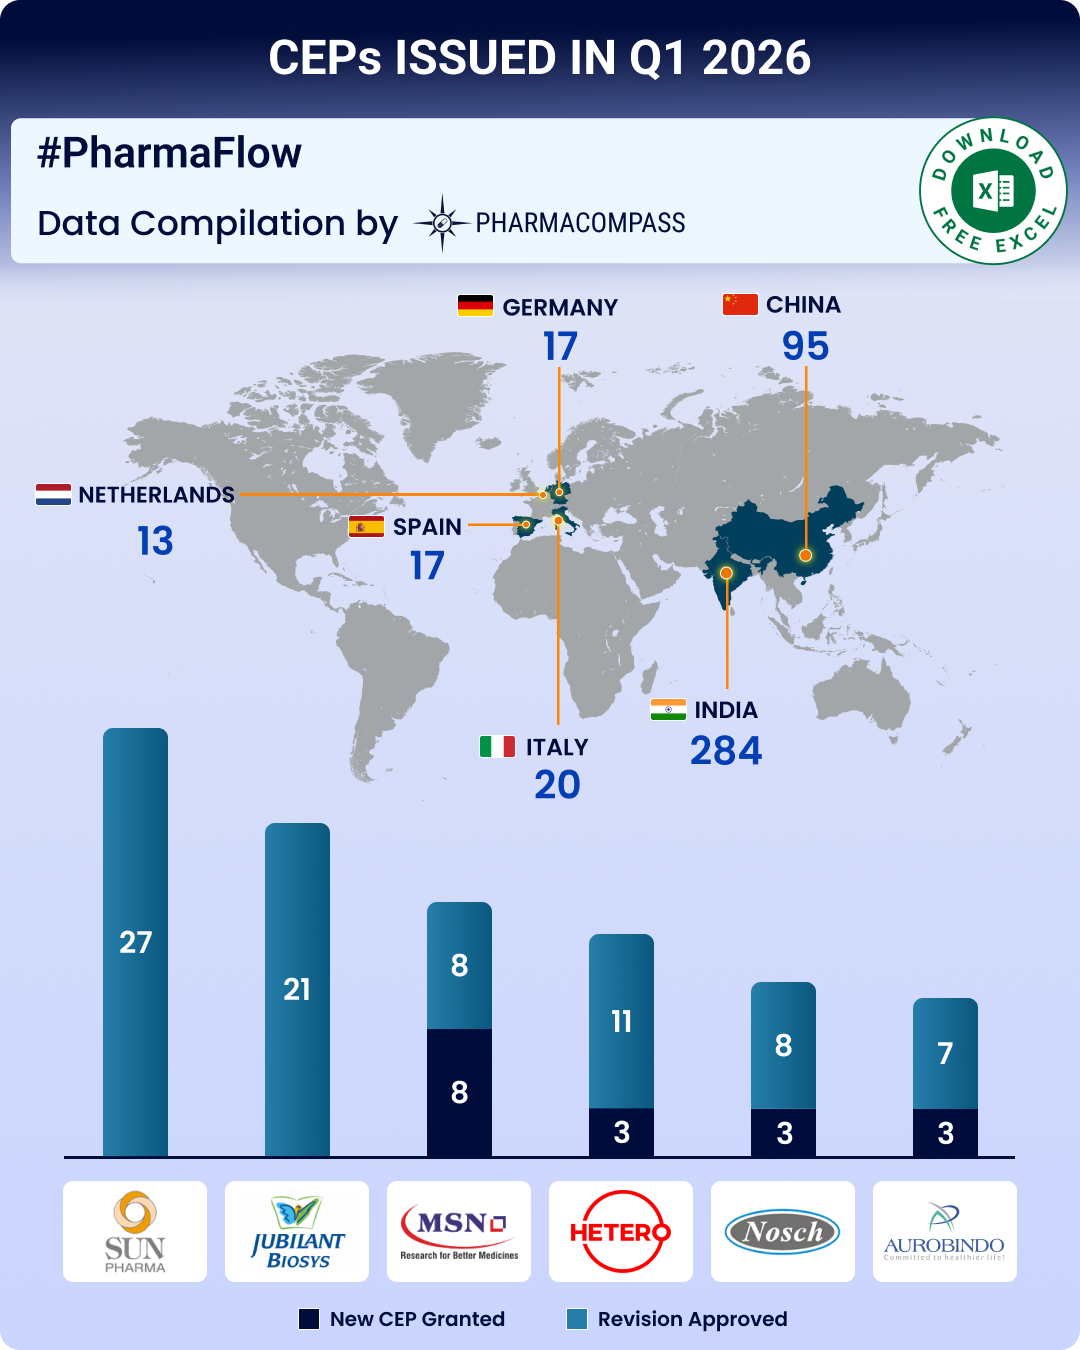
Nearly every
year, drugmakers ring in the new year with drug price increases in the US. This
year too, prices of over 450 prescription
medicines increased by an average of around 5 percent at the start of January.
This, when high drug prices have been one of the biggest political issues in
the US over the last few years.
PharmaCompass decided to usher in 2022 with a review of the US Medicare Part D Prescription Drug data recently released by the Centers for Medicare and Medicaid Services (CMS) for calendar year 2019. Using the available data, we have developed our own dashboard to show recent trends in consumption of prescription drugs. With this analysis, we hope our readers will get a better understanding of the world’s largest market for pharmaceuticals, as also a fix on where it may be headed.
View US Medicare Part D 2019 Drug Spending (Free Excel Available)
Rising healthcare, drug spends in US
Over the
last several years, we have repeatedly heard political leaders in the US
complain about high drug prices. Yet, drug prices and healthcare spends have
risen unabated.
America’s National Health Expenditure Accounts (NHEA) includes annual expenditures on healthcare goods and services, public health activities, the net cost of health insurance, and investment related to healthcare. In 2019, America’s national health expenditure (NHE) grew by 4.6 percent to US$ 3.8
trillion, accounting for 17.7 percent of the gross domestic product (GDP).
During the year, prescription drug spend increased by 5.7
percent to US$ 369.7 billion. In comparison, Medicare spend grew 6.7
percent to US$ 799.4 billion.
President
Joe Biden recently stressed on the need to cap the prices of essential drugs,
and said that the average American pays the highest prices for prescription
drugs anywhere in the world. Americans pay 10 times as much as other countries for life-saving insulin — the top selling prescription drug covered by the Part D program.
Pharma
companies, on the other hand, have vehemently argued against any price cuts in
the US, saying price cuts would hinder drug research and development for all
diseases.
View US Medicare Part D 2019 Drug Spending (Free Excel Available)
Patented drugs account for 80.3 percent of total Part D spend
Medicare is the US federal government’s program that
provides health insurance to most people who are 65 years
or older. Medicare’s Part D plan provides outpatient drug coverage through private
insurance companies that have contracts with the federal government. Eligible
people have to choose and enroll in a private prescription drug plan for Part D
coverage. Medicare Part B, on the other hand, covers a wide variety of
medically necessary outpatient services and some preventative services.
Prescription
drug coverage under Part D reached US$ 183 billion in 2019 — a growth of around 9 percent over 2018, when spending was US$ 168 billion. Spending
on patented drugs in 2019 accounted for around US$ 147 billion or 80.3 percent
of the total spend for the year. Generic drugs made up for the remaining 19.7
percent (approximately US$ 36 billion). In 2018, generic drugs worth US$ 35.8
billion were sold under Part D, accounting for 21 percent of the total spend
under the program.
View US Medicare Part D 2019 Drug Spending (Free Excel Available)
Eliquis ranks highest on Medicare’s brand drug spend
Under Part
D, endocrinology and oncology were the two therapeutic areas that generated
maximum revenue for pharma companies, driving home sales of over US$ 31.8
billion and US$ 23.5 billion, respectively. Neurology drugs generated sales of
around US$ 22.9 billion.
Among branded
drugs, Bristol Myers Squibb’s anticoagulant Eliquis (apixaban) was the most selling drug in 2019 under Part D, notching up about US$ 7.3 billion in sales — a rise of US$ 2.3 billion or 46 percent over 2018.
Celgene’s cancer drug Revlimid (lenalidomide) roped in US$ 4.7 billion (up
by 14.6 percent), while another anticoagulant drug Xarelto (rivaroxaban) by Janssen Pharma — a unit of Johnson & Johnson — fetched US$ 4.1 billion (up 20.6 percent) in sales through Part D. AbbVie’s anti-rheumatic drug Humira and Sanofi’s diabetes drug Lantus saw sales of around US$ 3.7 billion each
under the program.
Amongst
generics, the largest selling drug under Part D (by dosage units) was metformin (diabetes), followed by gabapentin (seizure), PEG3350 with
electrolyte (gastroenterology), metoprolol (hypertension) and atorvastatin (cholesterol). In 2019, the
overall dosage units sold also jumped higher by 2.25 billion units to 111.35
billion.
The sales
ranking of Part D does bare some similarities with the global ranking of
highest selling drugs. In 2020, Humira had retained its position as the highest
selling drug in the world, generating sales of US$ 20.4 billion. Both
Eliquis and Revlimid had retained their ranking as the third and fourth most
selling drugs, bringing home US$ 14.1 billion and US$ 12.1 billion in global
sales in 2020.
View US Medicare Part D 2019 Drug Spending (Free Excel Available)
Medicare’s inability to negotiate prices costs American taxpayers billions of dollars
Over the
years, drug companies have used Medicare’s
inability to negotiate prices under Part D to increase the prices of their
drugs significantly and rip off huge profits, a three-year-long US House
Oversight Committee investigation has revealed.
US taxpayers could have saved over US$ 25 billion in five years if the prices of just seven drugs — Humira, Imbruvica, Sensipar, Enbrel, Lantus, NovoLog and Lyrica — were negotiated by Medicare. Another US$ 16.7 billion could have been saved between
2011 and 2017 on insulin products manufactured by Eli Lilly, Novo Nordisk and Sanofi, which control 90 percent of the insulin market in the US, the committee’s report revealed.
Elsewhere in
the world, the same drugmakers are bending over backwards to get into medical
insurance programs. For instance, China reported that several international
pharma firms, many of them headquartered in the US, slashed the prices of their
drugs by up to 94 percent to get into the country’s national medical insurance coverage.
In the US — which accounted for around 46 percent of the global share of drugs in 2020 — senior citizens may have to pay more for medicines as the government announced a large hike in Medicare premiums for 2022
if an expensive Alzheimer’s drug, Aduhelm, is included in the list.
In order to
ensure inclusion in Medicare, Biogen slashed the price of Aduhelm by half — from US$ 56,000 to US$ 28,200 — just weeks before a crucial meeting called by the CMS. Clearly, this has set a precedent in an industry which is known for rampant price hikes and rarely for any price cuts. This could also be put forth as an example of what Medicare could achieve if it receives negotiation rights.
View US Medicare Part D 2019 Drug Spending (Free Excel Available)
Our view
President
Biden's Build Back Better legislation,
which the House passed last month, is up for vote in the Senate. The
legislation contains provisions that would allow Medicare to negotiate the
prices of some expensive drugs, penalize drugmakers who raise prices faster
than inflation and cap out-of-pocket costs for insulin at US$ 35 per month.
However, chances of the bill being passed in its present form are slim.
Even if the
Senate passes the bill, Medicare would be able to negotiate the prices of only 10 prescription drugs and insulin products in 2025.
The number would increase over the years, reaching 100 in six years, and hence
forth grow by 20 drugs a year.
It seems like 2022 won’t be the last year when January 1 will be braced with price hikes in the US by drugmakers. Looks like they will continue to make hay while the sun shines.
View US Medicare Part D 2019 Drug Spending (Free Excel Available)
Impressions: 2622
Acquisitions and spin-offs dominated headlines in 2019 and the tone was set very early with Bristol-Myers Squibb acquiring
New Jersey-based cancer drug company Celgene in a US$ 74 billion deal announced on
January 3, 2019. After factoring
in debt, the deal value ballooned to about US$ 95 billion, which according
to data compiled by Refinitiv, made it the largest healthcare deal on
record.
In the summer, AbbVie Inc,
which sells the world’s best-selling drug Humira, announced its acquisition of Allergan Plc, known for Botox and other cosmetic
treatments, for US$ 63 billion. While the companies are still awaiting
regulatory approval for their deal, with US$ 49 billion in combined 2019
revenues, the merged entity would rank amongst the biggest in the industry.
View Our Interactive Dashboard on Top drugs by sales in 2019 (Free Excel Available)
The big five by pharmaceutical sales — Pfizer,
Roche, J&J, Novartis and Merck
Pfizer
continued
to lead companies by pharmaceutical sales by reporting annual 2019 revenues of
US$ 51.8 billion, a decrease of US$ 1.9 billion, or 4 percent, compared to
2018. The decline was primarily attributed to the loss of exclusivity of Lyrica in 2019,
which witnessed its sales drop from US$ 5 billion in 2018 to US$ 3.3 billion in
2019.
In 2018, Pfizer’s then incoming CEO Albert Bourla had mentioned that the company did not see the need for any large-scale M&A activity as Pfizer had “the best pipeline” in its history, which needed the company to focus on deploying its capital to keep its pipeline flowing and execute on its drug launches.
Bourla stayed true to his word and barring the acquisition of Array Biopharma for US$ 11.4 billion and a spin-off to merge Upjohn, Pfizer’s off-patent branded and generic established medicines business with
Mylan, there weren’t any other big ticket deals which were announced.
The
Upjohn-Mylan merged entity will be called Viatris and is expected to have 2020
revenues between US$ 19 and US$ 20 billion
and could outpace Teva to
become the largest generic company in the world, in term of revenues.
Novartis, which had
followed Pfizer with the second largest revenues in the pharmaceutical industry
in 2018, reported its first full year earnings after spinning off its Alcon eye
care devices business division that
had US$ 7.15 billion in 2018 sales.
In 2019,
Novartis slipped two spots in the ranking after reporting total sales of US$
47.4 billion and its CEO Vas Narasimhan continued his deal-making spree by buying New
Jersey-headquartered The Medicines Company (MedCo) for US$ 9.7
billion to acquire a late-stage cholesterol-lowering
therapy named inclisiran.
As Takeda Pharmaceutical Co was
busy in 2019 on working to reduce its debt burden incurred due to its US$ 62
billion purchase of Shire Plc, which was announced in 2018, Novartis also purchased
the eye-disease medicine, Xiidra, from the Japanese drugmaker for US$ 5.3 billion.
Novartis’ management also spent a considerable part of 2019 dealing with data-integrity concerns which emerged from its 2018 buyout of AveXis, the
gene-therapy maker Novartis had acquired for US$ 8.7 billion.
The deal gave Novartis rights to Zolgensma,
a novel treatment intended for children less than two years of age with the
most severe form of spinal muscular atrophy (SMA). Priced at US$ 2.1 million,
Zolgensma is currently the world’s most expensive drug.
However,
in a shocking announcement, a month after approving the drug, the US Food and
Drug Administration (FDA) issued a press release on
data accuracy issues as the agency was informed by AveXis that
its personnel had manipulated data which
the FDA used to evaluate product comparability and nonclinical (animal)
pharmacology as part of the biologics license application (BLA), which was
submitted and reviewed by the FDA.
With US$
50.0 billion (CHF 48.5 billion) in annual pharmaceutical sales, Swiss drugmaker
Roche came in at number two position in 2019
as its sales grew 11 percent driven by
its multiple sclerosis medicine Ocrevus, haemophilia drug Hemlibra and cancer medicines Tecentriq and Perjeta.
Roche’s newly introduced medicines generated US$ 5.53 billion (CHF 5.4 billion) in growth, helping offset the impact of the competition from biosimilars for its three best-selling drugs MabThera/Rituxan, Herceptin and Avastin.
In late 2019, after months of increased
antitrust scrutiny, Roche completed
its US$ 5.1 billion acquisition of Spark Therapeutics to strengthen its presence in
gene therapy.
Last year, J&J reported almost flat worldwide sales of US$ 82.1 billion. J&J’s pharmaceutical division generated US$ 42.20 billion and its medical devices and consumer health divisions brought in US$ 25.96 billion and US$ 13.89 billion respectively.
Since J&J’s consumer health division sells analgesics, digestive health along with beauty and oral care products, the US$ 5.43 billion in consumer health sales from over-the-counter drugs and women’s health products was only used in our assessment of J&J’s total pharmaceutical revenues. With combined pharmaceutical sales of US$ 47.63 billion, J&J made it to number three on our list.
While the sales of products like Stelara, Darzalex, Imbruvica, Invega Sustenna drove J&J’s pharmaceutical business to grow by 4 percent over 2018, the firm had to contend with generic competition against key revenue contributors Remicade and Zytiga.
US-headquartered Merck, which is known as
MSD (short for Merck Sharp & Dohme) outside the United States and
Canada, is set to significantly move up the rankings next year fueled by its
cancer drug Keytruda, which witnessed a 55
percent increase in sales to US$ 11.1 billion.
Merck reported total revenues of US$ 41.75 billion and also
announced it will spin off its women’s health drugs,
biosimilar drugs and older products to create a new pharmaceutical
company with US$ 6.5 billion in annual revenues.
The firm had anticipated 2020 sales between US$ 48.8 billion and US$ 50.3 billion however this week it announced that the coronavirus pandemic will reduce 2020 sales by more than $2 billion.
View Our Interactive Dashboard on Top drugs by sales in 2019 (Free Excel Available)
Humira holds on to remain world’s best-selling drug
AbbVie’s acquisition of Allergan comes as the firm faces the expiration of patent protection for Humira, which brought in a staggering US$ 19.2 billion in sales last year for
the company. AbbVie has failed to successfully acquire or develop a major new
product to replace the sales generated by its flagship drug.
In 2019, Humira’s US revenues increased 8.6 percent to US$ 14.86 billion while internationally, due
to biosimilar competition, the sales dropped 31.1 percent to US$ 4.30 billion.
Bristol Myers Squibb’s Eliquis, which is also marketed by Pfizer, maintained its number two position
and posted total sales of US$ 12.1 billion, a 23 percent increase over 2018.
While Bristol Myers Squibb’s immunotherapy treatment Opdivo, sold in partnership with Ono in Japan, saw sales increase from US$ 7.57 billion to US$ 8.0 billion, the growth paled in comparison to the US$ 3.9
billion revenue increase of Opdivo’s key immunotherapy competitor Merck’s Keytruda.
Keytruda took the number three spot in drug sales that
previously belonged to Celgene’s Revlimid, which witnessed a sales decline from US$ 9.69 billion to US$ 9.4 billion.
Cancer treatment Imbruvica, which is marketed
by J&J and AbbVie, witnessed a 30 percent increase in sales. With US$ 8.1
billion in 2019 revenues, it took the number five position.
View Our Interactive Dashboard on Top drugs by sales in 2019 (Free Excel Available)
Vaccines – Covid-19 turns competitors into partners
This year has been dominated by the single biggest health emergency in years — the novel coronavirus (Covid-19) pandemic. As drugs continue to fail to meet expectations, vaccine development has received a lot of attention.
GSK reported the highest vaccine sales of all drugmakers with
total sales of US$ 8.4 billion (GBP 7.16 billion), a significant portion of its
total sales of US$ 41.8 billion (GBP 33.754 billion).
US-based Merck’s vaccine division also reported a significant increase in sales to US$ 8.0 billion and in 2019 received FDA and EU approval to market its Ebola vaccine Ervebo.
This is the first FDA-authorized vaccine against the deadly virus which causes
hemorrhagic fever and spreads from person to person through direct contact with
body fluids.
Pfizer and Sanofi also reported an increase in their vaccine sales to US$ 6.4
billion and US$ 6.2 billion respectively and the Covid-19 pandemic has recently
pushed drugmakers to move faster than ever before and has also converted
competitors into partners.
In a rare move, drug behemoths — Sanofi and GlaxoSmithKline (GSK) —joined hands to develop a vaccine for the novel coronavirus.
The two companies plan to start human trials
in the second half of this year, and if things go right, they will file
for potential approvals by the second half of 2021.
View Our Interactive Dashboard on Top drugs by sales in 2019 (Free Excel Available)
Our view
Covid-19 has brought the world economy to a grinding halt and shifted the global attention to the pharmaceutical industry’s capability to deliver solutions to address this pandemic.
Our compilation shows that vaccines and drugs
for infectious diseases currently form a tiny fraction of the total sales of
pharmaceutical companies and few drugs against infectious diseases rank high on
the sales list.
This could well explain the limited range of
options currently available to fight Covid-19. With the pandemic currently infecting
over 3 million people spread across more than 200 countries, we can safely
conclude that the scenario in 2020 will change substantially. And so should our
compilation of top drugs for the year.
View Our Interactive Dashboard on Top drugs by sales in 2019 (Free Excel Available)
Impressions: 54752
The year 2017 was a landmark year for pharmaceutical
industries in the US and Europe, with a sharp increase in the number of new molecular entities (NMEs) being approved in both geographies.
The US Food
and Drug Administration (USFDA) approved 46 NMEs in 2017, the second highest
since 1996 when 53 NMEs were approved. In Europe, the European Medicines Agency
(EMA) approved 35 drugs with a new active substance, up from 27 in 2016.
Sales for most major pharmaceutical
companies continued to grow in 2017. Earnings forecasts for 2018 have been raised due to the recent US tax reform that has
generated investor hopes for accelerated dividend growth and share buyback
plans.
This week, PharmaCompass brings
you a compilation of the top drugs of 2017 by sales revenue.
Click here to Access All the 2017 Data (Excel
version available) for FREE!
Top-sellers: Humira races ahead, despite launch of biosimilars; Enbrel a distant second
There wasn’t any upheaval
at the top of the pharma drug sales charts. AbbVie’s anti-TNF (tumor necrosis factor) giant
Humira (adalimumab), which is approved to treat
psoriasis and rheumatoid arthritis, added
almost another US $3 billion to its 2016 sales and posted nearly US $19 billion in revenues.
Last year, AbbVie’s raised expectations for Humira’s earnings to reach US $21 billion in global sales by 2020. The
company believes this drug will continue to be a significant cash contributor
until 2025 and the US $21 billion sales forecast
by 2020 is about US $3 billion higher than its expectation two years ago.
In 2016, the US Food and Drug Administration
(FDA) approved Amgen’s Amjevita (adalimumab-atto) — a biosimilar of Humira. And in 2017, another Humira biosimilar — Boehringer Ingelheim’s Cyltezo
(adalimumab-adbm) — received approval from the FDA and European authorities.
Click here to Access All the 2017 Data (Excel
version available) for FREE!
Enbrel (etanercept),
the longest-used biologic medicine for the treatment of rheumatism around the
world, was the second best-selling drug with US $8.262 billion in 2017 sales.
The sales of the drug were down from US $9.366 billion in
2016 owing to lower selling prices and increased
competition, which in turn hurt demand.
Since it was first approved in the United States in 1998,
Enbrel has been approved in over 100 countries and the drug is promoted by Amgen,
Pfizer
and Takeda
in different geographies.
Novartis’ biosimilar copy of Enbrel, which got approved by the FDA in August
2016 for the treatment of patients with
rheumatoid arthritis (RA), plaque psoriasis, ankylosing spondylitis (AS) and
other diseases is still not on the market because of a patent-protection
challenge from Amgen.
Amgen is arguing in the US federal court
that its drug has patent protection until 2029.
Click here to Access All the 2017 Data (Excel
version available) for FREE!
Fast-growing drugs: Eylea and Revlimid bring
fortunes for Regeneron and Celgene
Regeneron’s
flagship eye treatment, Eylea (aflibercept) which is marketed by Bayer outside the United States, added another US $1 billion in
annual sales last year to record US $8.260 billion in total sales. Eylea net
sales grew 11 percent year-on-year in the US and 19 percent year-over-year
outside the US.
The company believes much of the recent
growth in the US was driven by demographic trends with an aging population as
well as an overall increase in the prevalence of diabetes.
These demographic trends are expected to
continue in the coming years, providing an opportunity for continued growth.
Eylea sales alone contribute 63 percent to Regeneron’s total sales.
Click here to Access All the 2017 Data (Excel
version available) for FREE!
Celgene’s
Revlimid
(lenalidomide)
— a thalidomide derivative introduced in 2004 as an immunomodulatory agent for the treatment of various cancers such as multiple myeloma — brought in an additional US $1.2 billion in 2017 sales and had total revenues of US $8.187 billion.
Revlimid continues to contribute more than 60 percent to the company’s total sales of US $13 billion.
Celgene received a setback this month as the
USFDA refused to consider Celgene’s
application for ozanimod, an experimental
treatment for relapsing multiple sclerosis. The treatment was being seen as a
key to the company’s fortunes as Celgene had
said ozanimod is worth US $4 billion to
US $6
billion a year in peak sales.
Click here to Access All the 2017 Data (Excel
version available) for FREE!
Gilead’s Hepatitis C franchise enters free fall
Gilead Sciences’ blockbuster hepatitis C drugs franchise that includes Sovaldi and Harvoni continue to feel the
competitive heat as they registered US $9.137
billion in 2017 sales, down from US $14.834
billion the previous year.
While reporting 2017 results, Gilead provided guidance for
2018 and said its sales of Hepatitis C drugs could fall
further to US $3.5 billion - US $4 billion. At their peak in 2015, Gilead’s Sovaldi and Harvoni had together generated
US $19.1 billion in sales.
One of the major reasons for this drop is AbbVie’s launch of its new treatment Mavyret
at a deep price discount to the competition. AbbVie
also claims to have the shortest treatment course at eight weeks, compared with
12 weeks or longer for other treatments.
AbbVie reported US $1.274 billion in Hepatitis C drug sales
in 2017, down from US $1.522 billion in 2016.
Click here to Access All the 2017 Data (Excel
version available) for FREE!
Novartis’ Gleevec, Merck’s cardiovascular drugs, GSK’s Advair face generic heat
Novartis’ Gleevec (imatinib), which had at one point become the best-selling drug for Novartis and had brought in US $3.323 billion for the company in 2016, started facing generic competition last year and the anti-cancer drug lost US $1.380 billion in sales to bring in ‘only’ US $1.943 billion last year.
The US patents of Merck’s cardiovascular drugs — Zetia (Ezetimibe)
and Vytorin (Ezetimibe
and Simvastatin) — expired in April 2017. In May 2010, Merck and Glenmark
Pharmaceuticals entered into an agreement that allowed Glenmark to launch
a generic version of Zetia in late 2016. The drugs
that had combined sales of US $3.701
billion in 2016 felt the generic heat in 2017 and the sales were US
$1.606 billion lower at US $2.095
billion.
Click here to Access All the 2017 Data (Excel
version available) for FREE!
GSK’s Advair, which was expected
to encounter generic competition in 2017, continued to breathe easy as the FDA
found deficiencies in the applications of Hikma, Mylan and Sandoz.
All three failed to get the FDA nod for their generic versions of Advair, a drug used in the management of asthma and chronic obstructive pulmonary disease that generated sales worth US $4.431 billion (£3.130 billion) in 2017.
Top 15 drugs by sales
Here is PharmaCompass’ compilation
of the best-selling drugs of 2017. This is based on information extracted from
annual reports and US Securities and Exchange Commission (SEC) filings of major
pharmaceutical companies.
If you would like your own copy of all the information we’ve collected, email us at support@pharmacompass.com and we’ll send you an Excel version.
Click here to access all the 2017 data (Excel
version available) for FREE!
S. No.
Company / Companies
Product Name
Active Ingredient
Main Therapeutic Indication
2017 Revenue in Millions (USD)
1
AbbVie Inc., Eisai
Humira®
Adalimumab
Immunology (Organ Transplant, Arthritis etc.)
18,946
2
Amgen, Pfizer Inc., Takeda
Enbrel®
Etanercept
Immunology (Organ Transplant, Arthritis etc.)
8,262
3
Regeneron, Bayer
Eylea
Aflibercept
Ophthalmology
8,260
4
Celgene
Revlimid
Lenalidomide
Oncology
8,187
5
Roche
MabThera®/Rituxan®
Rituximab
Oncology
7,831
6
Johnson & Johnson, Merck, Mitsubishi Tanabe
Remicade®
Infliximab
Autoimmune Disorders
7,784
7
Roche
Herceptin®
Trastuzumab
Oncology
7,435
8
Bristol-Myers Squibb, Pfizer Inc.
Eliquis®
Apixaban
Cardiovascular Diseases
7,395
9
Roche
Avastin®
Bevacizumab
Oncology
7,089
10
Bayer, Johnson & Johnson
XareltoTM
Rivaroxaban
Cardiovascular Diseases
6,590
11
Bristol Myers Squibb, Ono Pharmaceutical
Opdivo
Nivolumab
Oncology
5,815
12
Sanofi
Lantus
Insulin Glargine
Diabetes
5,731
13
Pfizer Inc.
Prevnar 13/Prevenar 13
Pneumococcal 7-Valent Conjugate
Anti-bacterial
5,601
14
Pfizer Inc., Eisai
Lyrica
Pregabalin
Neurological/Mental Disorders
5,318
15
Amgen, Kyowa Hakko Kirin
Neulasta®
Pegfilgrastim
Blood Disorders
4,553
Sign up, stay ahead
In order to stay informed, and receive
industry updates along with our data compilations, do sign up for the PharmaCompass Newsletter and
you will receive updated information as it becomes available along with a lot
more industry analysis.
Click here to Access All
the 2017 Data (Excel version available) for FREE!
Impressions: 58407
This
week in Phispers, we bring you the latest twists in the GSK-Gilead rivalry over
HIV drugs. India, which recently banned beef nationwide, plans to now replace
gelatin with cellulose-based capsules. A lawsuit in the US says Mylan may have
overcharged the government US$ 1.27 billion in the form of rebates on EpiPens.
And, there is an update on the opioid crisis. Read on.
After beef, India mulls banning animal-based gelatin capsules
As India deals with the aftermath
of the controversial cattle trade ban, the Health Ministry is reviewing a proposal to replace gelatin capsules with cellulose-based capsules which are of plant origin and are “safe for use” as compared to animal-based gelatin capsules. Various stakeholders, NGOs and consumers have 21 days to weigh the pros and cons of this proposal and respond.
India’s ministry of health and family welfare constituted an expert committee on March 20 this year to address all technical issues pertaining to replacement of gelatin capsules with cellulose-based capsules for encapsulation of drugs.
The Indian government's ban on the
trade of cattle for slaughter threatens US$ 4 billion in annual beef exports and millions of
jobs if the government does not revoke it.
Indian meat traders, under the
aegis of the Qureshi Action Committee and other trade and industry
associations, plan to petition India's Supreme Court to get the government
order revoked.
As Pfizer
hikes price of 91 drugs, Maryland enacts law to curb generic drug price gouging
Last week, we had shared our list of drugs with ‘no patents and no competition’.
While our list provides tremendous opportunities for generic companies in the short-term, we also warned that the FDA’s continued focus on accelerating review of these drugs will require companies to rely on strategies less opportunistic than price gouging, to drive their future business growth.
On
October 1, 2017 Maryland will become the first state in the United States to enact a law prohibiting “price gouging” by generic pharmaceutical manufacturers. The Bill was passed by the Maryland General Assembly on April 20, 2017. On May 26, Maryland Governor Larry Hogan sent a letter to the Speaker of the
House stating that he would allow the bill to become law without his signature.
The move coincides with Pfizer
hiking the price of 91 drugs by an
average of 20 percent so far this year in the United States. This includes
price hikes for its erectile dysfunction treatment, Viagra, and
its pain drug, Lyrica, on
June 1.
There are two essential provisions of the Maryland Bill. First, it prohibits a generic drug manufacturer or wholesale distributor from engaging in price gouging in the sale of an “essential off-patent or generic drug.”
Second,
the Bill authorizes the Maryland Medical Assistance Program (MMAP) to notify
the Maryland Attorney General of a price increase when the Wholesale
Acquisition Cost (WAC) of a prescription drug increases by at least 50 percent
from the WAC within the preceding one-year period. Or, when the price paid by
MMAP would increase by at least 50 percent from the WAC within the preceding
one year period and the WAC for either a 30-day supply or a full course of
treatment exceeds US$ 80.
Mylan may have
received US$ 1.27 billion more in rebate for EpiPens
In
the US, Senate Judiciary Committee Chairman Charles Grassley released a Medicaid
investigator's report which highlighted that Mylan’s EpiPen may have received US$ 1.27 billion more from the rebate program from 2006 through 2016 than what the company was entitled to receive.
The
amount is nearly three times a proposed settlement that the company had
announced in October 2016.
Earlier,
Mylan had said it would return US $465 million
to the government as part of settlement negotiations with the Department of
Justice (DOJ). Talks with the DOJ continue.
Senator Grassley has been involved in a long exchange with Mylan questioning
the significant price-hikes which the company had implemented over the years.
The
EpiPen auto-injector, used to treat allergic reactions, cost US$ 57 a shot when
Mylan purchased it in 2007. However, a series of price increases has raised the cost
to more than US$ 600 for a pair of EpiPens.
Before the price hike controversy hit Mylan, the Epipen generated more than US$ 1 billion in sales and contributed about 40 percent to Mylan’s overall profits.
GSK, Gilead’s HIV contest heats up, as GSK goes for priority review
Two
of the top 10 fastest growing drugs in 2016 were those used to treat HIV. GlaxoSmithKline’s Triumeq (abacavir,
dolutegravir, lamivudine) and Gilead’s Genvoya (elvitegravir,
cobicistat, emtricitabine, tenofovir alafenamide), both generated a
sales growth in excess of US$ 1 billion.
For
a long time, Gilead dominated the HIV market. But GSK fought back recently. In
an effort to stay ahead in the game, GSK used a priority review voucher,
for which it paid US$ 130 million, to shave four months off its application approval process.
ViiV Healthcare, the global specialist
HIV company majority-owned by GSK, with Pfizer Inc and Shionogi Limited as its shareholders,
announced regulatory submissions to the European Medicines Agency (EMA) and US
Food and Drug Administration (FDA) for the first HIV maintenance regimen
single-tablet, which comprises of only two medicines. The two-drug regimen
contains dolutegravir (Tivicay, ViiV
Healthcare) and rilpivirine (Edurant,
Janssen Sciences Ireland UC).
However,
don’t count Gilead out. In four late-stage studies, the US company's new drug
bictegravir was found to be as effective as GSK's established dolutegravir,
which has been the cornerstone of the British group's growing HIV business in
recent years.
This
year, Gilead plans to apply for regulatory approval to sell its combination of
bictegravir and emtricitabine/tenofovir alafenamide
(FTC/TAF), with a submission in the US in the second quarter and in Europe in
the third quarter.
If
Gilead uses a priority voucher at the US FDA, it could launch in the US market
in the first quarter of 2018, industry analysts said.
Mallinckrodt
explores divestment of its generics business
Mallinckrodt Plc plans to sell off its generic drug unit in a deal that could fetch the company around US$ 2 billion. The move would also help the specialty
pharmaceutical maker shift towards higher-margin branded drugs.
Mallinckrodt's generics unit has
seen its sales plummeting, in part because some of its products include
opiate-based pain killers, which have fallen out of favor with doctors due to
their addictive potential.
The divestment would complete the company’s gradual shift away from its original focus on generic drugs and nuclear imaging towards branded specialty pharmaceuticals, which now make up for bulk of its revenues.
Between 2015 and 2016,
Mallinckrodt's generic drug sales declined around 18 percent, to just over US$
1 billion. During the same period, sales of branded specialty drugs increased
by around US$ 2.3 billion.
The England-based Mallinckrodt has reportedly hired investment bank Credit Suisse
Group AG to run a sale process for the unit.
Canadian researchers trace
the origins of the opioid crisis, as Ohio sues drug makers
Last week, the state of Ohio in
the US sued five major drug manufacturers, accusing them of misrepresenting the risks of prescription
opioid painkillers that have fueled a skyrocketing drug addiction epidemic.
Opioid drugs, including
prescription painkillers and heroin, killed more than 33,000 people in the
United States in 2015, more than any year on record, according to the US
Centers for Disease Control and Prevention.
Canadian researchers have traced
the origins of the current opioid crisis to a letter published in the New England Journal of Medicine (NEJM) in 1980,
which stated that opioids were not addictive. The original letter
titled ‘Addiction Rare in Patients Treated with Narcotics’, was just a
paragraph long.
The lone evidence the letter cited
was an anecdote that out of 11,882 hospitalized patients treated with
narcotics, only four patients with no history of addiction became addicted.
The journal's prestige helped fuel
this misguided belief. The letter was cited over 600 times, usually to argue
that opioids were not addictive.
Last week, the NEJM published an unusual warning for readers about the 1980 letter.
The editor's note on the original letter in the NEJM reads,
"For reasons of public health, readers should be aware that this letter
has been 'heavily and uncritically cited' as evidence that addiction is rare
with opioid therapy."
The five companies
Ohio sued were Purdue Pharma LP, Johnson & Johnson's Janssen Pharmaceuticals Inc unit, a unit of Endo International Plc, Teva Pharmaceutical Industries Ltd's Cephalon unit and Allergan Plc".
Impressions: 3177
This week, Phispers gets you news on illegal exports of Metformin in India, Hillary Clinton’s stance on price gouging, a report’s recommendations on reducing India’s dependence on Chinese APIs, Pfizer’s patent dispute case in the UK and more.
Aspen Pharma fined for price
gouging in Italy
Last week,
Italian antitrust authorities fined South Africa-based drug maker Aspen Pharmacare nearly US $ 5.5 million for
halting supplies of several cancer drugs. This is being seen as a negotiating
tactic designed to hike prices by as much as 1,500 percent.
The
products whose supplies were halted are: Leukeran 2 mg (chlorambucil);
Alkeran 50 mg / 10 mg powder and solvent (melphalan);
Alkeran 2 mg (melphalan); Purinethol 50 mg (mercaptopurine);
and Thioguanine 40 mg (thioguanine).
The
price-gouging episode began after Aspen purchased the drugs from GlaxoSmithKline. It then began negotiations with
the Italian Medicines Agency over pricing for the cancer medicines. According
to the Italian Competition Authority, Aspen also used the threat of a shortage
to achieve the prices it had sought, because the drugs temporarily disappeared
from the market.
It would
be interesting to see the price rise in the US market for these products since Chlorambucil
and Thioguanine have no generics in the United States. Clinton’s team had debated attacking FDA commissioner Califf, reveals WikiLeaks
Around
this time last year, the pharmaceutical industry had come under severe
criticism for price gouging. And, if emails released by WikiLeaks are to be believed, Hillary Clinton’s campaign team had debated attacking Dr. Robert Califf, over his ties with various drug makers. Back then, Califf had been nominated to head the US Food and Drug Administration. Earlier this year, Califf got named as FDA commissioner.The email thread, pertaining to September 21-26, 2015, suggests how the issue had become a factor in her campaign. Through these emails, few members of Clinton’s team had weighed the pros and cons of picking a fight that would “fit into the larger themes we are trying to promote,” an email written by Clinton’s campaign press secretary had said.Similarly, a senior policy advisor had written: “We could certainly signal that we want someone willing to stand up to pharma.”Califf was
the founding director of the Duke Clinical Research Institute, which conducts
studies for companies. He has authored numerous papers with industry
researchers. Two years ago, several large drug makers had partly supported his
salary, while many others paid him for consulting work. These
email exchanges took place amid rising outrage over price gouging, triggered by
Martin Shkreli (founder and former CEO of Turing Pharmaceuticals). In September
last year, Clinton had taken a jab at Shkreli through a tweet, for hiking the
price of the antimalarial drug Daraprim by more than 5,000 percent. Clinton’s campaign staff had tweeted: “FYI – We have started the war with Pharma!!” Last
month, Clinton issued a plan to contain prescription drug pricing. She proposed
a federal panel of officials to determine if price increases for certain drugs
are justified, authorize the federal government to directly purchase drugs
through imports of competing drugs from other countries, and fine offending
companies. India initiates action against two Metformin
makers for illegal exports
The Food
and Drug Administration of Maharashtra, India has initiated action against two pharmaceutical companies – Pharmaceutical Products of India Ltd and Wanbury – for illegally rebranding and exporting a diabetic drug to Mexico, Brazil, Bangladesh and Pakistan.A part of the bulk drug – metformin hydrochloride – was being manufactured by Pharmaceutical Products of India, based in Tarapur. It was manufacturing 300,000 kilos of metformin hydrochloride for export every month. The company, however, did not have an export licence. On further investigation, the department found that the drug was sold to another firm – Wanbury in Patalganga – that had an export licence. The modus operandi was clear – Wanbury had an export licence and orders worth 650,000 kg per month of metformin HCL, but had a shortfall of 350,000 kg in manufacturing capacity, which was being fulfilled by Pharmaceutical Products of lndia. “Wanbury would just stick their labels on the drugs supplied by the latter without any quality checks,” said a Maharashtra FDA official. “Such unholy alliances can have disastrous effects on the country's drug export sector,” the official added. The companies have been charged under the Drugs and Cosmetics Act. Industry watchers share how
deregulation brings further risks
Last week,
in Speak Pharma, Bernard Plau, CEO of
Akovia Consulting, talked about how fraud broke the trust of regulators. And this week, industry watchers – Dinesh Thakur and Prashant Reddy Thikkavarapu – share how deregulation by the Drug Controller General of India (DCGI) brings further risk, in an article published on The News Minute, titled “Deregulation of the pharma industry in the time of scandals’.
Since the Ranbaxy scandal, there have been several
other scandals in the Indian pharmaceutical industry, and these have involved
big names such as Sun, Dr. Reddy’s, Wockhardt, GVK Bio and Alkem. These companies have come under
scrutiny from foreign drug regulators.
Thakur and
Thikkavarapu say two kind of scandals have plagued the Indian pharma industry. The
first is related to data fabrication by contract research organisations (CROs)
that conduct bioequivalence (BE) testing. The second type involves drug
companies indulging in fabrication of data during quality testing.
“Instead of increasing regulatory scrutiny, the DGCI has been on a drive to reduce the regulation governing the Indian pharmaceutical industry in the name of ‘Make in India’,” they added.
Indian trade body study suggests
ways of reducing dependence on Chinese APIs
A study
undertaken by trade body Assocham and market research firm RNCOS has
highlighted how India’s overwhelming dependence on China for APIs has emerged as a worrisome area. The study has recommended steps that can help reduce imports of APIs from China – which stand at Rs 138.53 billion (US $ 2.08 billion), or 65.29 percent of the total API imports of Rs 212.16 billion (US $ 3.18 billion).
“This is all the more disconcerting in the face of louder narrative against reducing trade gap with China, which is well over US $ 51 billion,” the study says.
One of the main reasons for huge API imports from China is the low cost of manufacturing and subsidy there. Moreover, India levies negligible import fee. “The import fees should be increased in line with other counterparts”, the paper said.
The
existence of multiple regulatory authorities for renewal of licences by India’s bulk drug manufacturers is also affecting production. “Therefore a single committee of various government departments should be formed to regulate the industry through a single window and audit of plants,” the study said. It also recommended developing mega parks for APIs across the country.
More bad news for Teva as it mulls acquisition of Korea’s CelltrionLast week,
PharmaCompass covered Teva’s misadventure in Mexico. Little did we know that more bad
news awaited Teva. Just one month after Teva paid Regeneron US $ 250 million to get access to a new pain drug – fasinumab, the FDA has put its clinical trial on hold. The news
comes at a time when Teva is said to be considering the acquisition of South Korea’s Celltrion in order to strengthen its biosimilar portfolio. Going forward, biosimilars are said to be a key element of Teva’s overall strategy.
Teva and Regeneron’s fasinumab was being studied in a Phase IIb trial in chronic low back pain, among others tests including osteoarthrosis pain. The FDA is now asking the two partners for “an amendment of the study protocol” after seeing a case of adjudicated arthropathy (a disease of the joint) in a patient receiving high-dose fasinumab, who had advanced osteoarthritis.The two
companies said they would now set about designing a pivotal Phase III study in
chronic low back pain that specifically excludes patients with advanced
osteoarthritis in the hope this was a one-off related to this disease. Pfizer loses appeal in a UK patent
dispute case over Lyrica
Pfizer lost an appeal in a UK patent dispute over Lyrica, one of the company’s top-selling drugs. The Court of Appeal upheld a 2015 verdict that had struck down key patent claims on Lyrica by Pfizer and cleared Allergan Plc’s Actavis generic unit of infringing it.
The
disputed patent covers the use of pregabalin for the treatment of pain. The business was bought by Teva this year. In 2015, Lyrica – which is also used to treat epilepsy – generated sales of US $ 4.8 billion for Pfizer.
Pfizer has
also sued Dr. Reddy’s Laboratories and Teva Pharmaceutical Industries
over their generic pregabalin products. These days, Lyrica is used more for
pain than for its original indication as a seizure drug.
Pfizer now
hopes to take its fight to the UK Supreme Court. “We maintain our belief in the validity and importance” of the patent, said Pfizer spokeswoman.
Explosion at BASF’s biggest plant in Germany kills twoOn October
17, an explosion and fire at chemicals maker BASF's production site in Germany is said
to have killed at least two people and severely injured six.
The explosion occurred at around 11.20 am local time, on a supply line connecting a harbor and a tank depot on the Ludwigshafen site. BASF is the world’s biggest chemicals company and the Ludwigshafen site, which is situated around 80 km south of Frankfurt, is the world's largest chemical complex, covering an area of 10 square km. The site employs 39,000 workers. Located on the Rhine river, the Ludwigshafen site receives many of its raw materials by ship.
The
company said it was unclear so far what caused the explosion. BASF is also
unclear about the financial impact of the explosion.
Impressions: 4737
The year 2015 has gone down
in history as a record year for mergers and acquisitions in the pharmaceutical
and biotech space with deals worth US $ 300 billion being announced. The highlight
of the year was the Pfizer-Allergan mega-merger – the biggest-ever pharma transaction worth more than US $ 160 billion.
Pharma Letter tracked transactions
through the year and found the number of deals exceeding US $1 billion at 30 in
2015, as compared to 26 in 2014 and 20 in 2013. In all, a total of 166 M&A
deals were announced in 2015 (out of which some are yet to be completed),
compared to 137 in 2014.
This week, PharmaCompass
brings you a compilation of the top drugs of 2015 by sales revenue and growth.
Sofosbuvir – the outright winner of 2015
2015 was the year of Sofosbuvir – the revolutionary active ingredient used for the treatment of hepatitis. Together, through the sale of drugs Harvoni and
Sovaldi, Sofosbuvir brought in sales of almost US $ 19 billion.
The PharmaCompass prediction
that Harvoni (a combination of Ledipasvir and Sofosbuvir; and used for the treatment
of infectious diseases like hepatitis and HIV) would become the best-selling
drug ever in 2015 fell slightly short of expectations as its sales of US $ 13.864
billion were marginally less than AbbVie’s rheumatoid arthritis treatment – Humira.
Humira retained its place as the best-selling drug with US $
14.012 billion in sales in 2015. However, with sales growth of US $ 11.737
billion in a single year, Harvoni is poised to become the best-selling drug by
the end of 2016.
Top 20 Drugs by Sales
Here is PharmaCompass’ compilation of the best-selling drugs of 2015. This is based on information
extracted from annual reports and US Securities and Exchange Commission (SEC) filings
of major pharmaceutical companies.
If you would like your own copy of all the information we’ve collected, email us at support@pharmacompass.com and we’ll send you an Excel version.
Click here to access all
the 2015 data (Excel version available) for FREE!
Product
Active Ingredient
Main Therapeutic Indication
Company
2014 Revenue in Millions
(USD)
2015 Revenue in Millions
(USD)
2015 Sales Difference
Millions (USD)
1
Humira
Adalimumab
Immunology (Organ Transplant, Arthritis etc.)
AbbVie
12,543
14,012
1,469
2
Harvoni
Ledipasvir
and Sofosbuvir
Infectious Diseases (HIV, Hepatitis etc.)
Gilead
Sciences
2,127
13,864
11,737
3
Enbrel
Etanercept
Immunology (Organ Transplant, Arthritis etc.)
Amgen / Pfizer
4,688
8,697
4009
4
Remicade
Infliximab
Immunology (Organ Transplant, Arthritis etc.)
Johnson
& Johnson / Merck
6,868
8,355
1487
5
MabThera/Rituxan
Rituximab
Oncology
Roche
5,659
7,115
1,456
6
Lantus
Insulin Glargine
Diabetes
Sanofi
6,978
7,029
51
7
Avastin
Bevacizumab
Oncology
Roche
6,481
6,751
270
8
Herceptin
Trastuzumab
Oncology
Roche
6,338
6,603
265
9
Revlimid
Lenalidomide
Blood Related Disorders
Celgene
Corpoartion
4,980
5,801
821
10
Sovaldi
Sofosbuvir
Infectious Diseases (HIV, Hepatitis etc.)
Gilead
Sciences
10,283
5,276
(5,007)
11
Seretide / Advair
Salmeterol
Respiratory Disorders
GlaxoSmithKline
6,005
5,227
(778)
12
Crestor
Rosuvastatin
Calcium
Cardiovascular
AstraZeneca
5,512
5,017
(495)
13
Lyrica
Pregabalin
Neuroscience and Mental Health
Pfizer
Inc.
5,168
4,839
(329)
14
Neulasta
Pegfilgrastim
Blood Related Disorders
Amgen
4,596
4,715
119
15
Gleevec / Glivec
Imatinib
Oncology
Novartis
4,746
4,658
(88)
16
Xarelto
Rivaroxaban
Anticoagulants
Bayer / Johnson
& Johnson
3,369
4,345
976
17
Copaxone
Glatiramer
Neuroscience and Mental Health
Teva
4,237
4,023
(214)
18
Januvia
Sitagliptin
Diabetes
Merck
& Co
3,931
3,863
(68)
19
Abilify
Aripiprazole
Neuroscience and Mental Health
Bristol-Myers
Squibb/ Otsuka
Holdings
6,485
3,804
(2681)
20
Tecfidera
Dimethyl
Fumarate
Neuroscience and Mental Health
Biogen
2,909
3,638
729
Click here to access all
the 2015 data (Excel version available) for FREE!
A year of record FDA approvals
2015 was also the
year when the US Food and Drug Administration (FDA) approved 45 novel drugs, another
all-time record high. In January this year, PharmaCompass had compiled a list of novel drugs approved by the FDA in 2015. We also extensively covered the new dosage forms of existing drugs approved in 2015. Do go through the article published on January 14, 2016, for more information.
PharmaCompass’ compilation of sales forecasts of novel drugs indicated a significant
variation in estimates. However, in our view, drugs that
saw highest sales growth in 2015 are likely to do well this year as well.
Top 20 drugs by sales growth (in USD, millions)
Product
Active Ingredient
Main Therapeutic Indication
2014 Revenue in Millions
(USD)
2015 Revenue in Millions
(USD)
2015 Sales Difference
Millions (USD)
1
Harvoni
Ledipasvir
and Sofosbuvir
Infectious Diseases (HIV, Hepatitis etc.)
2,127
13,864
11,737
2
Viekira Pak
Ombitasvir/Paritaprevir/Ritonavir
Infectious Diseases (HIV, Hepatitis etc.)
48
1,639
1,591
3
Humira
Adalimumab
Immunology (Organ Transplant, Arthritis etc.)
12,543
14,012
1,469
4
Hepatits C Franchise
Daclatasvir and Asunaprevir
Infectious Diseases (HIV, Hepatitis etc.)
256
1,603
1,347
5
Imbruvica
Ibrutinib
Chronic lymphocytic leukemia
200
1,443
1,243
6
Cubicin
Daptomycin
Anti-bacterial
25
1,127
1,102
7
Eliquis
Apixaban
Anticoagulants
774
1,860
1,086
8
Triumeq
Abacavir, Dolutegravir and Lamivudine
Infectious Diseases (HIV, Hepatitis etc.)
-
1,037
1,037
9
Xarelto
Rivaroxaban
Anticoagulants
3,369
4,345
976
10
Opdivo
Nivolumab
Oncology
6
942
936
11
Revlimid
Lenalidomide
Blood Related Disorders
4,980
5,801
821
12
Tecfidera
Dimethyl
Fumarate
Neuroscience and Mental Health
2,909
3,638
729
13
Xtandi
Enzalutamide
Oncology
480
1,207
727
14
Ibrance
Palbociclib
Oncology
-
723
723
15
Invokana / Invokamet
Canagliflozin
Type 2 diabetes
586
1,308
722
16
Victoza
Liraglutide
Diabetes
2,014
2,704
690
17
Stribild
Cobicistat, Elvitegravir, Emtricitabine and Tenofovir
Disoproxil Fumarate
Infectious Diseases (HIV, Hepatitis etc.)
1,197
1,825
628
18
Levemir
Insulin
Diabetes
2,133
2,745
612
19
Votrient
Pazopanib
Oncology
565
565
20
Perjeta
Pertuzumab
Oncology
927
1459
532
Hepatitis C products, which had three
of the four highest sales growths in 2015, clearly show the impact these
revolutionary treatments will have on the global healthcare landscape in time
to come. Cancer immunotherapy treatments, a new generation of blood thinners
and novel diabetes treatments were some of the others which demonstrated stellar
growth in 2015.
Vaccines from Pfizer and Sanofi also displayed tremendous sales growth although they
have not been included in the compilation of drugs.
Click here to access all
the 2015 data (Excel version available) for FREE!
Sign Up, Stay Ahead
While some companies like Boehringer and Valeant are yet to release their annual reports. In order to
stay informed, do sign up for the PharmaCompass
Newsletter and you will receive updated information as it becomes available
along with a lot more industry analysis.
Click here to access all
the 2015 data (Excel version available) for FREE!
CORRECTION, April 12, 2016: An earlier version of this compilation
did not account for cases where the same drug is sold by multiple companies
(e.g. Enbrel, Remicade, Xarelto etc.). As an outcome, a re-ranking of the Top
20 Drugs by Sales and Sales Growth has been done.
Impressions: 56504
We always knew math was fuzzy, but never imagined addition could get so
complicated.
A recent publication on 2014 Global Prescription Medication Statistics listed the top pharmaceutical corporations by revenues, the best
selling products along with the top therapy areas.
The list, based on data published by IMS Health,
caught us by surprise since a previous publication by FiercePharma had a completely different order when ranking the top 15 pharmaceutical
companies.
As the difference in revenues of the top-10 companies was in excess of $60 billion and IMS Health’s data is an industry standard for decision making, we dug deeper to analyze the correlation between the information in the annual reports and IMS Health’s statistics.
Which pharmaceutical company is the largest?
Simply put, the answer is, ‘it depends’ on how you define a pharmaceutical company.
Should divisions like diagnostics, animal health, vaccines, consumer
health be counted when determining the size of a pharmaceutical company?
FiercePharma, in their analysis, used the total
revenue of all divisions of the organizations to determine the largest
organization; in their case it is Johnson & Johnson.
IMS determines their numbers by measuring “prescription sales and dispensing” and hence, excludes divisions like diagnostics, consumer health and animal health, making Novartis the largest
company.
As currency exchange rate fluctuations have their own, big role, in
determining the size of organizations, we believed it would be best to share
the revenues, as presented, so that you can draw your own conclusions.
Table 1/ Sales comparison for top pharmaceutical companies in 2014 from different sources (IMS, Fierce Pharma and Annual Reports)
Big Pharma
IMS Rank
IMS Sales
(US $Mn)
Fierce Pharma Rank
Fierce Pharma Sales (US $Mn)
Group Sales based on the Annual Report
(Currency as reported, Mn)
Novartis
1
51,307
2
57,996
USD
57,996
Pfizer
2
44,929
4
49,605
USD
49,605
Sanofi
3
40,037
5
43,070
Euro
33,770
Roche
4
37,607
3
49,866
CHF 49,866
Merck & Co
5
36,550
6
42,237
USD
42,237
Johnson &
Johnson
6
36,422
1
74,331
USD
74,331
AstraZeneca
7
33,313
8
26,095
USD
26,095
Glaxo SmithKline
8
31,470
7
37,960
GBP
23,006
Teva
9
26,001
11
20,272
USD
20,272
Gilead Sciences
10
23,673
10
24,474
USD
24,890
Amgen
11
20,473
12
20,063
USD
20,063
Lilly
12
19,909
14
19,615
USD 19,615
AbbVie
13
19,049
13
19,960
USD
19,960
Bayer
14
18,347
9
25,470
Euro
42,239
Bristol-Myers
Squibb
Not
in Top 20
15
15,879
USD
15,879
NB: Mn is million
Click here to access and download all
the 2014 data (Excel version available) for FREE!
Since each group has multiple divisions, we further split the sales for
you to brainstorm:
Table 2/ Sales comparison of the different divisions of top
pharmaceutical companies in 2014 (Annual Reports in Mn)
Big Pharma
Pharma Division
Vaccine Division
Generics
Consumer Health
Other Divisions
Medical Devices/ Diagnostics Division
Animal Health Division
Divestures/ Other adjustments
Novartis
USD 31,791
Sandoz USD 9,562
Alcon USD 10,827
USD 5,816
Pfizer
USD 45,708
USD 3,446
USD 451
Sanofi
Euro 22,578
Euro 3,974
Euro 1,805
Euro 3,337
Euro 2,076
Roche
CHF 38,969
CHF 10,897
Merck & Co
USD 30,740
USD 5,302
USD 6,195
Johnson &
Johnson
USD 32,313
USD 14,496
USD 27,522
AstraZeneca
USD 26,095
Glaxo SmithKline
GBP 18,670
GBP 4,336
Teva
USD 10,458
USD 9,814
Gilead Sciences
USD 24,474
USD 416
Amgen
USD
19,327
USD 736
Lilly
USD 16,481
USD 788
USD 2,346
AbbVie
USD 19,960
Bayer
Euro 12,052
Euro 7,923
Euro 22,264
Bristol-Myers
Squibb
USD 15,879
Click here to access and download all
the 2014 data (Excel version available) for FREE!
Not sure that it adds any extra clarity on what should define a global pharmaceutical company…
Since the various divisions make
companies complicated to assess, what about product sales?
The good news is that we have a winner!
Humira®, AbbVie’s monoclonal antibody Adalimumab, used to treat rheumatoid and other types of arthritis, is the highest selling product globally. IMS reported Humira’s annual sales for 2014 at $11,844 million, while AbbVie mentions their sales of Humira at $12,543 million, the difference: a mere $700 million! However, with IMS gathering data across various points of the supply chain, and the recent volatility of the currency markets, we believe that a difference of 5.5% of total sales is within range of reason.
Unfortunately, things stopped making sense the moment we reached the
number-two product on the IMS list. Lantus®,
Sanofi’s insulin glargine, recorded sales of Euro 6,344 million (based on Sanofi’s 2014 annual report), while IMS mentions Lantus sales were $10,331 million last year. In addition, Sanofi has an 11% growth rate reported while IMS indicates a growth of 30%.
So unless the Euro/Dollar exchange rate moves back towards the 1.5
range, there seems to be a serious difference in the way the product sales are
calculated by companies and by IMS.
Using information available in the annual reports and other company declarations, we attempted to compare IMS’ Top 20 Global Products 2014 with available public information, to only find more complications!
Table 3/ Sales comparison of the top pharmaceutical products in 2014 (IMS vs Annual Reports)
Products
IMS Rank
IMS Sales (US $Mn)
Annual Reports Sales (US $Mn)
Pharma
Compass Rank
Big Pharma
Currency
Annual Reports Sales in Mn
Marketing Partner
Marketing Partner Annual Report Sales
(US $Mn)
Humira®
1
11,844
12,543
1
Abbvie
USD
12,543
Lantus®
2
10,331
7,676
5
Sanofi
Euro
6,344
Sovaldi®
3
9,375
10,283
2
Gilead Sciences
USD
10,283
Abilify®
4
9,285
7,556
6
Bristol
Myers-Squibb
USD
2,020
Otsuka
5,536
Enbrel®
5
8,707
8,538
4
Amgen
USD
4,688
Pfizer
3,850
Seretide®
6
8,652
6,589
8
GSK
GBP
4,229
Crestor®
7
8,473
5,512
11
AstraZeneca
USD
5,512
Remicade®
8
8,097
9,880
3
Johnson &
Johnson
USD
6,868
Merck & Co.
2,372
Mitsubishi
Tanabe
640
Nexium®
9
7,681
3,655
19
AstraZeneca
USD
3,655
Mabthera®
10
6,552
6,936
7
Roche
CHF
5,603
Roche
1,305
Avastin®
11
6,070
6,449
9
Roche
CHF
6,417
Lyrica®
12
6,002
5,168
12
Pfizer
USD
5,168
Herceptin®
13
5,564
6,306
10
Roche
CHF
6,275
Spiriva®
14
5,483
3,917
17
Boehringer
Euro
3,237
Januvia®
15
4,991
3,931
16
Merck & Co.
USD
3,931
Copaxone®
16
4,788
4,237
14
Teva
USD
4,237
Novorapid®
17
4,718
2,835
20
Novo Nordisk
DKK
17,449
Neulasta®
18
4,627
4,596
13
Amgen
USD
4,596
Symbicort®
19
4,535
3,801
18
AstraZeneca
USD
3,801
Lucentis®
20
4,437
4,152
15
Novartis
USD
2,441
Roche
1,711
Click here to access and download all
the 2014 data (Excel version available) for FREE!
It’s clear that the methods used to determine product sales are considerably different between IMS and the pharmaceutical companies, however there is a range of consistency as well. How accurate is each information really depends on the analyst’s point of view.
Our take:
With over $350 billion in total sales, we have provided our raw data for your review since we are certain that there are opportunities worth capitalizing
upon and others, which may not be worthwhile to pursue.
While the assessment of pharmaceutical sales is far more complicated
than what we had originally imaged, the focus of Big Pharma on small molecules
is on Hepatitis C drugs (Sofosbuvir, Olysio, AbbVie Hep C), blood thinners, Eliquis® (Apixaban), Xarelto®(Rivaroxaban) and of course ‘tinib’ cancer treatments.
Table 4/ Growth of ‘tinib’ cancer treatments in 2014 (Annual Reports)
Products
Big Pharma
Sales (US $Mn) 2013
Sales (US $Mn) 2014
Growth (%)
Ibrutinib
Pharmacyclics,
Inc
(now
AbbVie)
14
492
3414%
Dasatinib
Bristol-Myers
Squibb
1280
1493
17%
Trametinib
GSK
10
68
580%
Nilotinib
Novartis
1266
1529
21%
Ruxolitinib
Novartis
163
279
71%
Ceritinib
Novartis
Not
launched
31
Sunitinib
Maleate
Pfizer
1204
1174
-2%
Crizotinib
Pfizer
282
438
55%
Axitinib
Pfizer
319
410
29%
Tofacitinib
Citrate
Pfizer
114
308
170%
Click here to access and download all
the 2014 data (Excel version available) for FREE!
However, Big Pharma is now all about biologics.
IMS’s data indicates that the top 10 products have only 5 biologics, while our calculations have 8 out of the top 10 products as biologics. The future strategy is best summed up by the statement in Bristol-Myers Squibb’s annual report “Just 5 years ago, we had about 40% of our development projects in biologics. If we look forward 3-5 years, we believe that number could potentially grow to about 75%”.
The barriers of entry for generic competition and potential windfalls have made rivals come together to co-market Synagis® (AbbVie & AstraZeneca), Remicade® (Johnson & Johnson, Merck and Tanabe), Xolair® and Lucentis® (Roche & Novartis).
Our pharmaceutical whisper (phisper): join the bio-age or bio-degrade!
Impressions: 12778