


DMF filings rise 4.5% in Q3 2025; China holds lead, India records 20% growth in submissions
The
third quarter (Q3) of 2025 witnessed a steady rise in Drug Master File (DMF) submissions to the
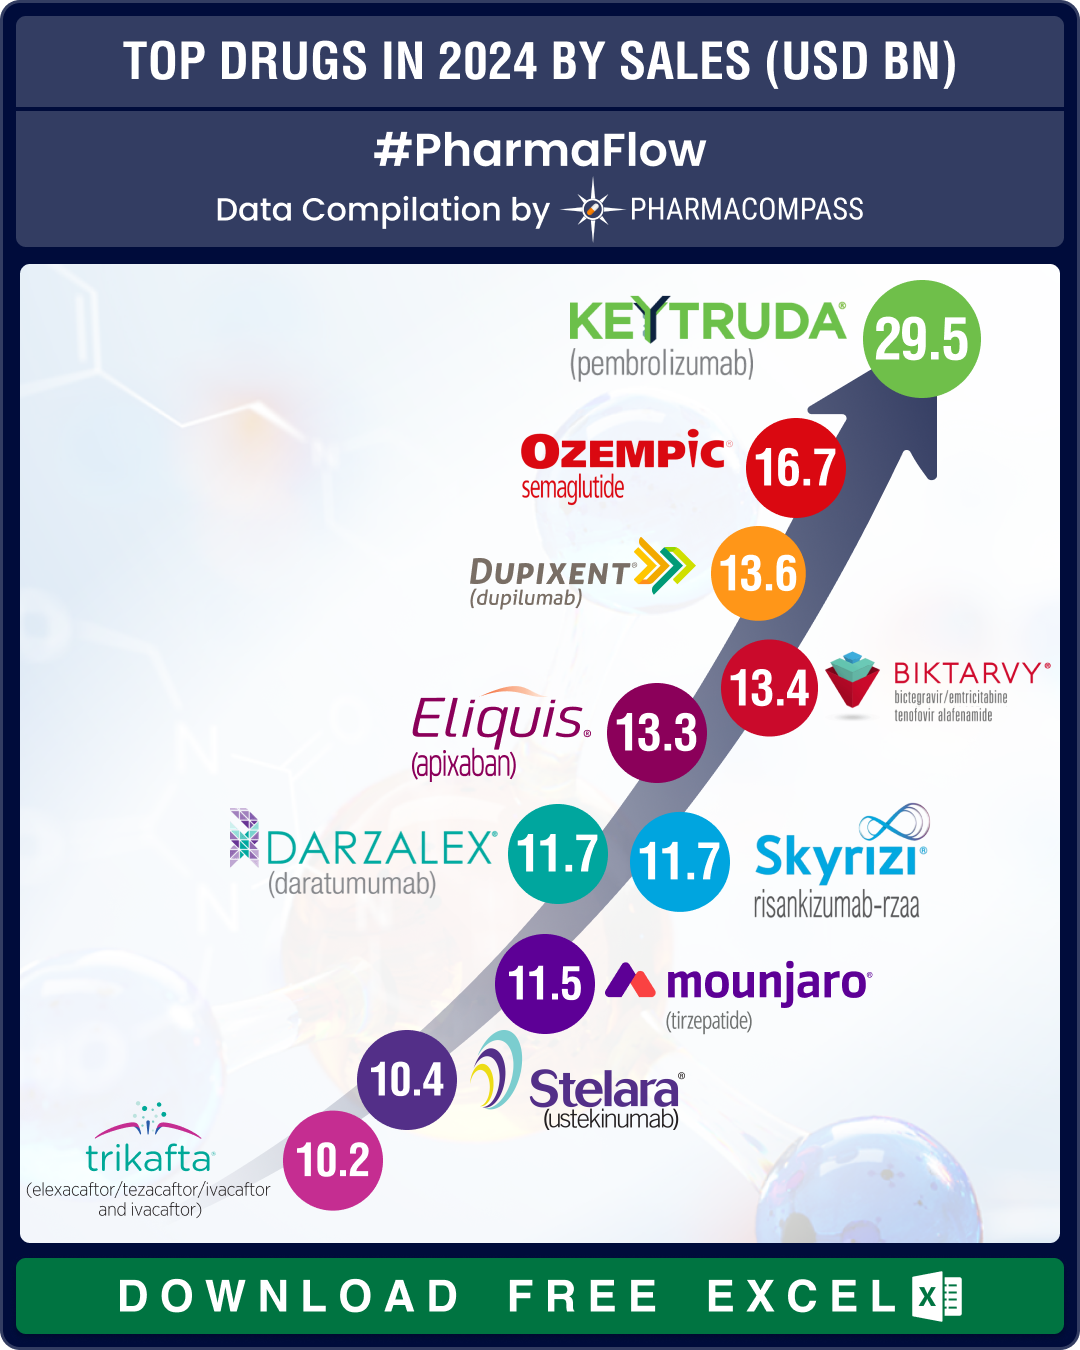
Top Pharma Companies & Drugs in 2024: Merck’s Keytruda maintains top spot as Novo’s semaglutide nips at its heels
In 2024, Big Pharma players consolidated
and maintained their dominance, even as innovation continu
- Privacy policy
- Terms and conditions
- Disclaimers
-

- Product listings are provided for informational purposes only. We do not supply or sell any products. Any products that may be covered by patent(s) are supplied solely for uses permitted under Section 107A of the Indian Patents Act and not for commercial sale.